All analytics aren’t created equal.
Here’s a simple guide to wind analytics, from the basic end of the maintenance spectrum to the most advanced.Right now, critical electric infrastructure matters more than ever. And for wind power owners and operators, every megawatt hour of annual energy production is critical. That’s why forward-thinking power producers and utilities are building and buying analytics technologies. Yet all analytics aren’t created equal. That’s why we’ve created this simple guide to wind analytics, from the basic end of the spectrum to the most advanced.
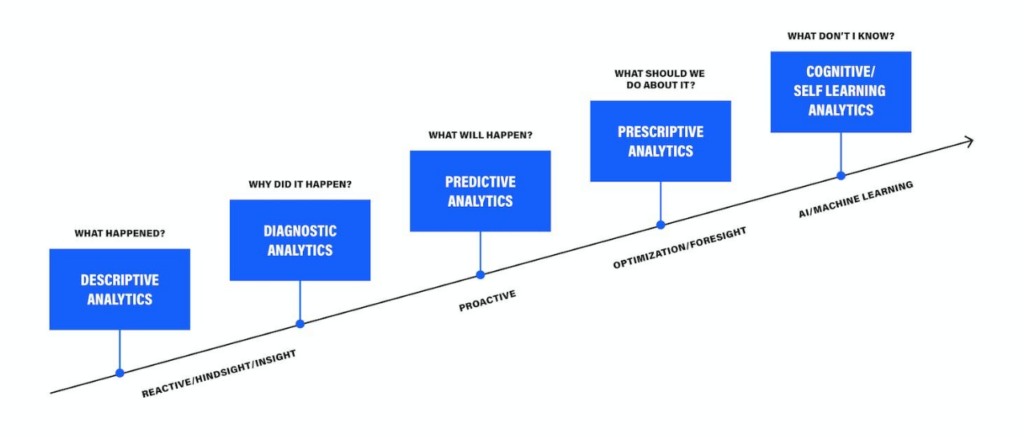
Level 1: Business Intelligence. Often called descriptive analytics, these tools are crucial for reporting to senior management, and visualizing historical and near-real-time data. In wind, BI enables better understanding of causes of downtime and a clearer overall view of asset health.
Level 2: Rules & Condition-Based Monitoring. This group includes a range of technologies, from simple signal thresholds set by subject matter experts (SMEs) to advanced diagnostic tools that detect and identify abnormal activity across several inputs like temperature, pressure, and vibration. These real-time alerts can help focus reliability engineering and operations activity toward turbines with issues.
Level 3: Predictive Analytics. These provide alerts based on data signatures before a failure occurs, offering a level of specificity that enables action—not just investigation. Prognostics like this can prevent catastrophic asset failures and save operations and maintenance costs by allowing operations teams to plan more effectively.
Level 4: Productivity AI. Until recently, the wind data conversation focused largely on reducing downtime and predicting failures. Yet as availability increases across most fleets, challenges around power performance begin to matter more. Unfortunately, most underperformance detection has not caught up to the need, with typical models relying too heavily on the manufacturer’s design curve. Advanced machine learning techniques have recently begun to enable productivity models that:
filter out a variety of cases like icing and constrained operations control for confounding variables like wind direction and air density incorporate additional benchmarks like historical performance and data from surrounding peer turbines.
Level 5: Dynamic Maintenance. In a perfect world, asset management and operations teams would be able to combine all of the above to optimize in real time for O&M costs, AEP, asset life, and market demand. This is where we’re headed as an industry, but we’re not there yet. The good news is that owners can set up a dynamic maintenance framework now — incorporating insights from the best available analytics technologies to make decisions at the asset, site, and fleet level.
By following these simple principles, our wind customers have increased AEP by 2%. Get a free assessment of the value at stake for your wind sites.