
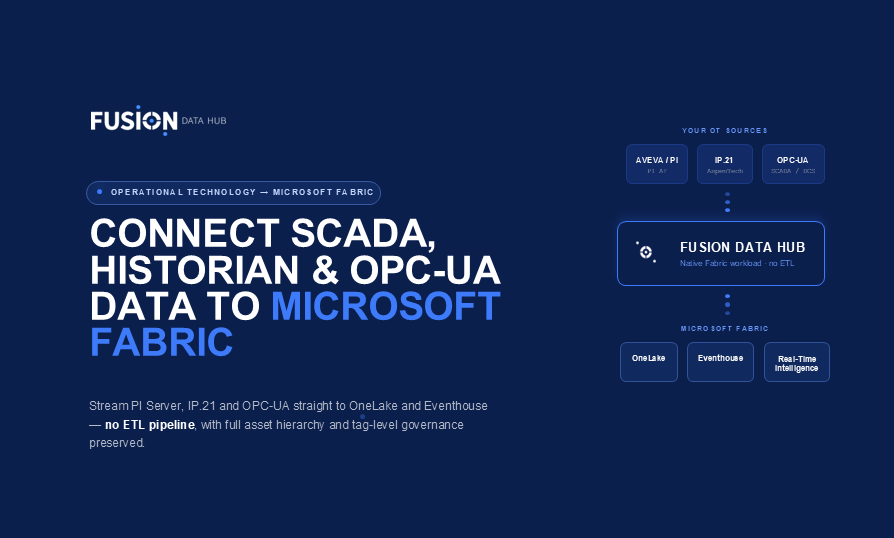
If your organisation runs Microsoft Fabric for enterprise analytics but still manages SCADA, PI Server, IP.21, and OPC-UA data separately, you are not alone. Nearly every industrial company that has adopted Fabric faces the same architectural problem: operational technology (OT) data and information technology (IT) data live in different worlds – governed by different teams, stored in different systems, and analysed in different tools.
This article explains why traditional approaches to connecting SCADA data to Microsoft Fabric create more problems than they solve, how Fabric-native workloads fundamentally change the architecture, and what organisations should look for when evaluating options. If you want the short version: the newest generation of native Fabric workloads eliminates the ETL pipeline entirely – while preserving the asset hierarchy, engineering metadata, and tag-level governance that make industrial data useful in the first place.
Why Connecting SCADA Data to Microsoft Fabric Is Harder Than It Looks
SCADA systems and industrial historians have been collecting operational data for decades. They know your processes intimately – every temperature reading, valve state, flow rate, alarm event, and batch record is logged with millisecond precision. That data is extraordinarily valuable. The problem is getting it into Fabric in a way that actually delivers on its value.
Most organisations attempting SCADA data integration with Microsoft Fabric fall into one of three patterns. Each works to a degree. Each has significant drawbacks.
Pattern 1: Azure IoT Hub or Event Hubs as a bridge
The most common appro ach routes SCADA telemetry through Azure IoT Hub or Event Hubs into a storage layer, then uses Fabric Data Factory or Spark notebooks to transform and load it into a Lakehouse. This works – but at a cost. The pipeline introduces latency measured in minutes rather than milliseconds, requires ongoing maintenance, and means your operational data is never truly in sync with your enterprise data. You end up with two copies of the truth.
Pattern 2: Direct database replication from historians
Some historians offer ODBC, REST, or JDBC connectors. Teams use these to pull data into Azure Blob Storage or ADLS Gen2, then shortcut it into OneLake. Again, this works – but you are now maintaining a replication job, dealing with schema drift every time a new tag is added, and managing access policies in two places simultaneously. Worse, the asset hierarchy and equipment metadata from the historian is typically lost during the export.
Pattern 3: A parallel analytics stack for OT
Many industrial organisations simply give up on unification and maintain a separate analytics environment for OT data – PI Vision, Honeywell UniSim, or similar historian analytics tools – alongside Fabric. This means your AI agents, Copilot experiences, and Power BI dashboards can never reason over the complete picture. Operational context is permanently missing from enterprise decisions.
The real cost of OT-IT data silos is not technical debt. It is the operational intelligence you cannot build because your AI systems cannot see your process data – and the asset context that gets lost every time data crosses a boundary.
Fabric-Native vs External Connectors: What Industrial Data Teams Need to Know
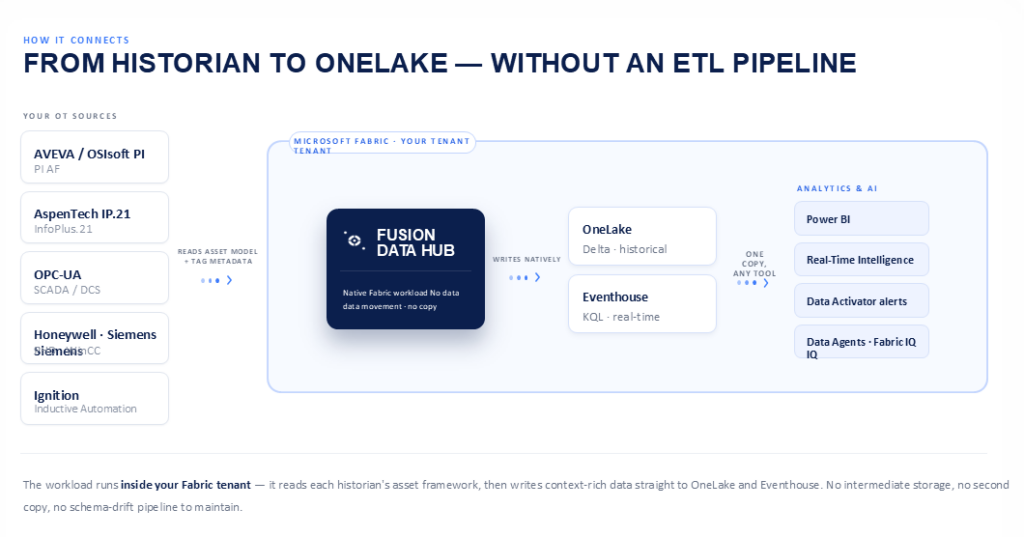
The Microsoft Fabric Extensibility Toolkit, announced as generally available at FabCon 2026, introduced a new integration model. Instead of connecting to Fabric from outside, ISV workloads now run inside Fabric – as first-class workspace items with inherited security, shared OneLake storage, native Eventhouse integration, and no separate login or data copy.
For SCADA and historian data, this is not a marginal improvement. It is a fundamental architectural shift, and it matters for five specific reasons that external connectors cannot match:
1. No data movement, no data duplication
A native workload reads directly from your OT sources and writes to OneLake in your tenant. The data never leaves your environment, and there is no second copy sitting in an intermediate storage layer. For governance, compliance, and cost, this is the single most consequential difference.
2. Asset hierarchy and tag-level context preserved
This is where Fusion Data Hub differs fundamentally from simple connectors, and it is the point most ETL pipelines miss. A raw sensor value is nearly useless without context: what equipment it came from, where that equipment sits in the plant hierarchy, what engineering unit it is measured in, what its normal operating range is, and what alarms fired around it. Fusion Data Hub captures this context natively – mapping your historian’s asset tree, tag metadata, equipment templates, and engineering units into OneLake as structured data that Fabric analytics can actually reason over. Tag-level filtering lets you publish only the signals you need, with the governance you require.
3. Native Eventhouse integration for real-time intelligence
Fusion Data Hub writes streaming sensor data directly to Fabric Eventhouse, which means KQL queries, Real-Time Intelligence dashboards, and Fabric Data Activator alerts work on live operational data. This is not possible with batch ETL approaches, and it is critical for condition monitoring, process deviation detection, and any use case where the value of data decays quickly.
4. Inherited Fabric security – one governance model, not two
Native workloads inherit workspace roles and Microsoft Entra ID security groups automatically. Row-level security policies apply consistently. The same Fabric administrator who controls access to your data warehouse controls access to your historian data. There is no separate OT access management system to maintain alongside your Fabric governance model.
How Fusion Data Hub Streams PI Server, IP.21, and OPC-UA to OneLake and Eventhouse
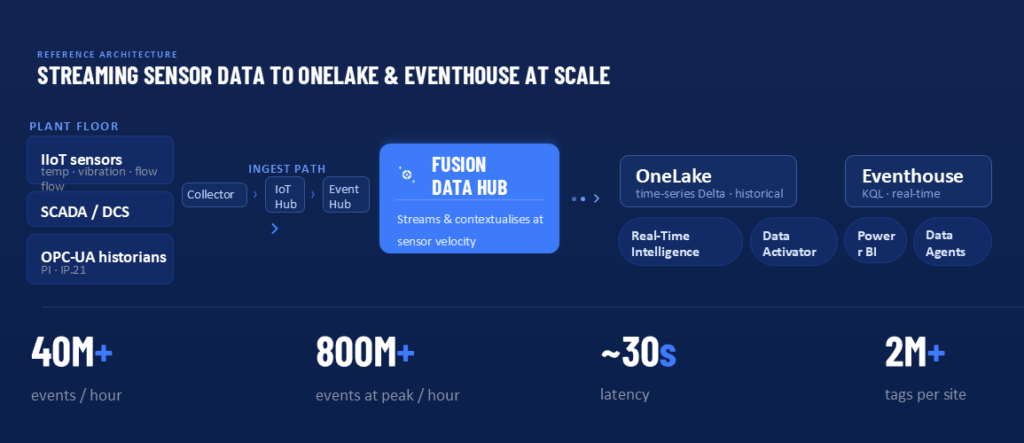
Rather than describing integration abstractly, here is what actually happens when you install the Fusion Data Hub workload from the Microsoft Fabric Workload Hub and connect your first source:
Source connection – PI Server, OPC-UA, SCADA and more
Fusion Data Hub includes production-ready connectors for the historian and SCADA systems that industrial organisations actually run: OSIsoft PI / AVEVA PI Server, AspenTech IP.21 (Aspen InfoPlus.21), Honeywell PHD and Uniformance, Siemens WinCC and SIMATIC historians, Ignition SCADA by Inductive Automation, and any OPC-UA compliant source.
Asset model ingestion and contextualisation
Before a single value flows, Fusion Data Hub reads your historian’s asset framework – PI AF, or OPC-UA address space – and maps it to a structured model in OneLake. Tag metadata, engineering units, equipment templates, and hierarchical relationships are preserved. This is the step that makes downstream analytics meaningful and is almost always missing from DIY ETL approaches.
Streaming to OneLake and Eventhouse
Recent sensor values stream to Fabric Eventhouse live for Real-Time Intelligence workloads. Historical data is written to OneLake in Delta Lake format, partitioned by time and asset hierarchy for efficient Spark and T-SQL queries. The same semantic model serves both – meaning a Power BI report, a KQL query, and a Fabric Data Agent all query the same data without format conversion or duplication.
Governance, lineage, and Purview integration
Because data lands natively in OneLake, it is automatically visible to Microsoft Purview for cataloguing, sensitivity labelling, and lineage tracking. Tag-level access policies, row-level security, and column masking apply consistently. Fusion Data Hub writes metadata in a way that Purview understands – so your industrial data is governed with the same rigour as your financial and HR data from day one.
Key Benefits for Data Architects and Digital Transformation Leads
For data architects designing Fabric-based platforms, and for digital transformation leads accountable for operational analytics outcomes, a native workload changes the conversation in specific ways:
- Architecture simplification. One less pipeline to build, monitor, and maintain. One fewer place where schema drift can break your reports.
- Faster time to value. Typical deployments go from signed contract to production data flowing in 4–6 weeks, not the 6–12 month timeline common for custom ETL builds.
- Governance consolidation. OT data falls under the same Fabric workspace roles, Purview policies, and Entra ID groups as enterprise data. Audit becomes tractable.
- AI-readiness from day one. Fabric Data Agents and Fabric IQ can reason over operational data immediately, because it lives in OneLake with full asset context.
- Lower total cost of ownership. Consumption-based pricing on existing Fabric capacity replaces per-connector licensing and custom pipeline maintenance.
- Real-time operational alerting. Fabric Data Activator rules can fire on live sensor data in Eventhouse – the same engine that monitors your business events.
Real-World Deployments: Who Is Using This Today
Fusion Data Hub is being evaluated and deployed by top-tier energy, materials, and heavy manufacturing organisations – including publicly referenced deployments in North American steel manufacturing and upstream oil and gas operations. These organisations share a common profile: significant existing investment in Microsoft Fabric, a large installed base of historians, and digital transformation programs that cannot succeed without unifying OT and IT data on a single platform.
To understand exactly what a deployment would look like in your environment, book a no-cost pilot consultation. Our team will audit your historian and SCADA sources, map them to a Fabric OneLake and Eventhouse architecture, and give you a custom scope, capacity estimate, and implementation timeline at no cost. Learn more about Fusion Data Hub or explore the full documentation.
Read a short checklist of Fusion Data Hub Workload on Fabric Implementation Timeline. What to Expect