

For more than 20 years, companies have established strategies for collecting data from the field using traditional historians as a way to provide engineering, operations management, and even enterprise systems with the ability to access historical data from the field. Many of these systems have evolved to provide various types of data from time series to events, tag configurations to hierarchical views of the world to make things easier for clients to understand the context. The demand for this data has increased, and the acceleration that organizations have experienced in recent years is pushing the boundaries of these systems to support the various functions of industrial operations.
The challenge is many of these systems reside behind firewalls and have hardware or license limitations that constrain the use of that data across multiple use cases.
Over the last few years, we have seen new “standards” and “As a service” models introduced to provide access to field operations data to the various groups. We see technologies from various parts of the ecosystem:
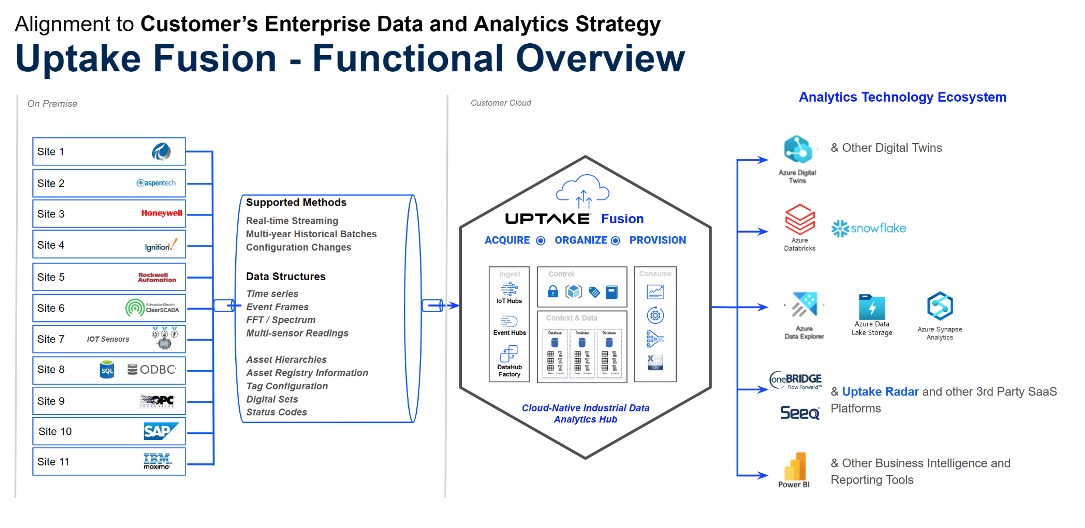
Fusion’s purpose is to help consolidate industrial data from the various industrial data sources so our customers have access to organized data within the right context of the analytics applications. In addition, Fusion provides a layer of abstraction to protect the underlying critical systems from high-performance data inquiries and cyber-security concerns. It is important to note that we can integrate with the above options should our customers choose any of those methods.
Many of our clients are looking for data reliability, provenance, granularity, and consistency to ensure quality data to the various analytics consumers throughout their analytics lifecycle, from experimentation to operationalization and sustainment.
As a result, Fusion provides additional 1st party connectivity options to process historians such as OSIsoft PI, Rockwell Automation, Emerson, and soon to the Aspentech Infoplus.21, to name a few.
For the most part, clients are familiar with “connectors,” “agents,” or simply “interfaces.” However, our 1st party connectivity options are more than that. They allow Fusion to establish a layer of protection and behave as a single source of truth, as shown by the trending tool below, where data from multiple systems can be visualized together for diagnostics and investigation or selection of datasets.


Fusion’s 1st party connectivity options encapsulate best practices to ensure we meet those data requirements for the various systems. These are some of the key capabilities that make those connectivity options beyond just simple connectors:
Fusion Data Hub is not just a data broker, data pipeline, or interface. Our focus is delivering quality data (streaming and historical) to the analytics consumers by acquiring, organizing, and distributing the data.
Over the years, we have implemented various standard OPC and MQTT broker interfaces. The reality is that many vendors have not completed the implementation of the entire specifications, and as a result, we find interfaces somewhere unstable. As well as being able to meet all the requirements above, multiple methods will have to be implemented, integrated, and managed.
We see clients implementing single pipelines that can extract aggregated data and provide it from the source system to various endpoints. However, as new requirements for data appear from other analytics applications, a new pipeline needs to be created with a different level of aggregation. This drives load and introduces inconsistency in the data used by one application vs. the other one.
Thus, when comparing Fusion to other methods, it is important to consider that the native connectivity options that Fusion provides are beyond the capabilities that each of those other options provides. We believe that data requirements are based on value, so if you have already implemented any of those options, Fusion can co-exist and ingest data from them as well. As requirements evolve, you can leverage more capabilities to support the needs of your industrial data analytics ecosystem.
We are in a race to reduce and/or eliminate carbon footprints in everything we do. The energy transition is moving us toward that path with very aggressive expectations by 2050. As a result, the pace of innovation has started to increase on many fronts to tackle the sources of GHG emissions across industries such as Iron Ore, Steel, Chemicals, Oil & Gas, and Transportation. They require massive capital projects as it relates to complex changes on the design of process equipment and overall industrial processes and manufacturing. While all of that gets resolved, the question is, what can we do now?
A 2021 Carbon Measurement Survey Report by Boston Consulting Group revealed that 85% of organizations are concerned about reducing their emissions, but only 9% are able to measure their emissions comprehensively. What is more revealing is that more important from this report is that the respondents estimate that 30% to 40% average error rate in their emissions measurements. In 2022, NewClimate Institute and Carbon Market Watch released a report highlighting the fact that major global companies are avoiding meaningful climate action and are instead using false, misleading, or ambiguous green claims.
“As pressure on companies to act on climate change rises, their ambitious-sounding headline claims all too often lack real substance, which can mislead both consumers and the regulators that are core to guiding their strategic direction. Even companies that are doing relatively well exaggerate their ambitions,” said NewClimate’s Thomas Day, the lead author of the report.
Recommended Approach
So how do we begin addressing these challenges? There are five parallel steps:

You cannot control what you cannot measure. Each organization needs to Identify & Measure Scope 1 and 2 emissions. But is Scope 3 the most important one? Yes, see item 4, and collaborate with your customers and suppliers, but if they are not measuring Scopes 1 and 2, it will be hard for them to help you with Scope 3.
This typically requires an accurate understanding of the patterns and performance over time.
There are more than 10 reporting frameworks that vary by industry, regional locations, and jurisdictions, among others.
Scope 3 is the largest and the hardest to manage as it requires a collaborative and transparent approach across multiple businesses in your supply and value chain.
Regulators and auditors will want to trace the data to the source.
Based on our voice of customers across four industries – Mining, Oil & Gas, Power Generation, and Textile the challenges can be summarized as follows:
There is not a one-size-fits-all approach. There is not one company that can provide all the components required for this. It is important to understand what each party delivers and brings to the table. This is a high-level architecture diagram on which Fusion will play a critical role in acquiring and consolidating the data on behalf of our clients to then report the data to the various corporate packages and external sources, including blockchain-based applications.

Fusion is able to ingest data from various sources and sites and in various formats from time series, events, IoT-sensor-based messages, activity-based, remote sensing satellites to even image-based data as required. It keeps track of the data source provenance and is able to track versions of data as changes happen on the underlying source system.
In Fusion, organizations can implement their calculations and/or interact with third-party specialized tools for more complex energy and water balances. Due to the openness of Fusion, organizations can share/exchange data with third-party providers such as labs and/or approved carbon footprint estimators. The results can be tracked as versions of the data for comparison purposes. The same share/exchange methods can be used with your customers and suppliers.
You already have a supplier for ESG reporting; not a problem. You need to keep in mind that the data collected for ESG reporting is required by other applications and business functions in the organization. Fusion provides a single source of truth foundation for the industrial data so it can serve your ESG reporting needs and the needs of other functions. This helps break the silos in decision-making.
The ESG reporting data is highly sensitive. This is not an issue with Fusion. Fusion can segregate the data into multiple repositories so sensitive data can be protected yet accessible by any authorized party.
Users can inquire Fusion for performance trends using our aggregation capabilities that can expand various reporting cycles – weekly, monthly, quarterly, or annually.
The pressure is on organizations to move away from Greenwashing to Transparency:

It was May 2020, and a mid-sized pulp and paper company was struggling to navigate the global pandemic’s demands on businesses. With supply chains disrupted, limited access to spare parts to keep their equipment up and running, and reduced capacity due to employees working from home, the company struggled to stay afloat.
To stay in business, their CEO, Helen, turned to a self-serve analytics platform to help her quickly adapt to the changing market conditions. With her data accessible in the cloud, she was able to collaborate remotely with Jeffrey, a data scientist, and Michael, the maintenance and reliability business function lead. Their data-driven decisions helped the company survive and even thrive during the pandemic.
Helen created a dashboard that let her adjust production schedules while considering the current overall equipment effectiveness, asset health, and spare parts inventory. She also analyzed sales data and customer feedback to identify new product opportunities and adjust their marketing strategy accordingly.
Additionally, Nadine, the leader of their people team, used self-serve analytics to bring in data from manually updated spreadsheets that tracked the health and safety of their employees, ensuring that they had the proper protective equipment and that workspaces were properly sanitized.
By using self-serve analytics to adapt to the changing market conditions, the company was able to stay in business during the pandemic and continue serving their customers. The platform allowed them to make data-driven decisions quickly and collaborate remotely, which was critical when in-person meetings and interactions were limited.
Today, companies need to respond quickly if they are going to remain competitive. We use data to make decisions, which traditionally has required a fair amount of analysis done by data scientists and IT personnel solely responsible for generating reports and insights. Sometimes, this process can be slow and inefficient. This is where self-serve analytics comes in. Self-serve analytics empowers users to access and analyze data independently without needing specialized personnel or software. In this blog post, I’ll explore the benefits of self-serve analytics for the industrial process control industry, including improved decision-making, increased efficiency, reduced costs, and more.
Here are some of the many advantages of self-serve analytics:
“The highest quality data is data that is validated at the source”
–Dr. Dave Shook, Chief Data Officer, Uptake Fusion
Be Careful – There are dangers and pitfalls that you have to look out for
While self-serve analytics can offer many benefits, there are also some pitfalls to be aware of. Here are a few potential drawbacks:
It’s important to consider these potential pitfalls when considering whether to use self-serve analytics over having trained data scientists perform the analysis. While self-serve analytics can offer many benefits, organizations should weigh these potential drawbacks against their specific needs and resources.
Of course, I’m going to show you how to get started using my product, Fusion Data Hub. Even so, many of the things I’m going to talk about should be applicable regardless of what analytics tools you are using.
This might seem like a fairly trivial activity. You’ve got a nice big dump of data from IT, or maybe you’ve found a spreadsheet with all the data in it. If you aren’t lucky enough to have all the data already, let’s grab some from our single source of truth.
With Fusion, I can browse the model of my plant. This model was automatically generated from my Rockwell Factorytalk system. I can either search for or browse to the piece of equipment I’m interested in, find all the sensor data available, and add it to a trend.
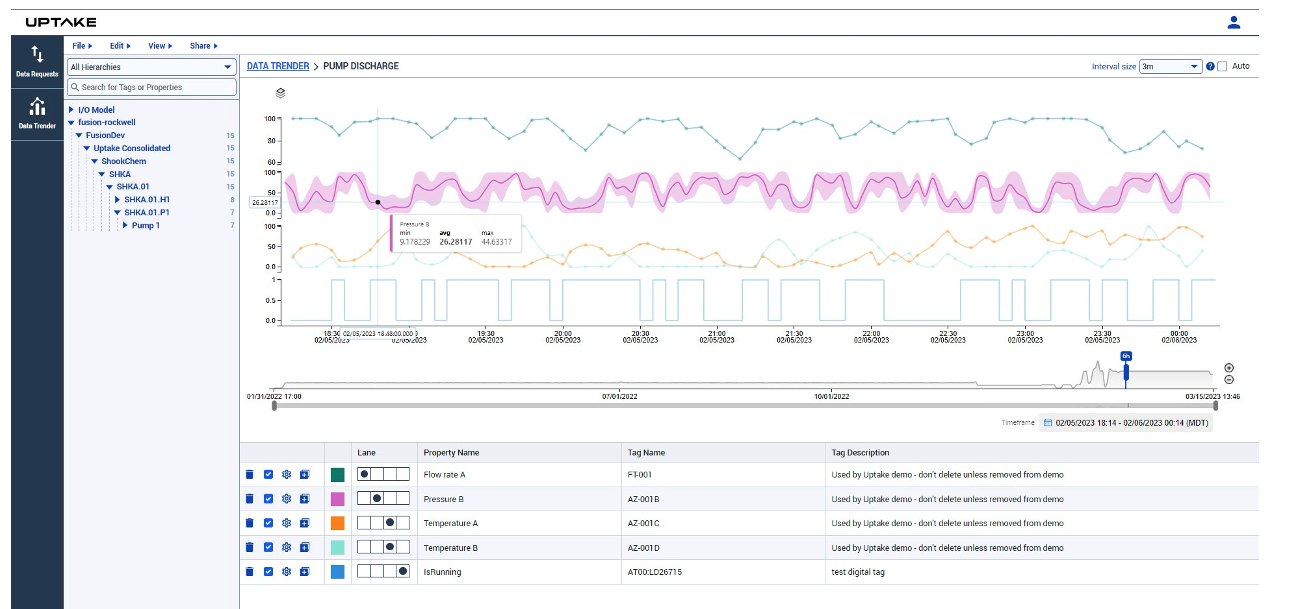
Being able to visualize your data right away is an important step in making sure that this is good data. Trending the data lets you spot gaps where data may be missing. It enables you to spot obvious outliers, spikes, or anomalies. It also lets you compare the values for an asset that is performing poorly against one that is known to be working well.
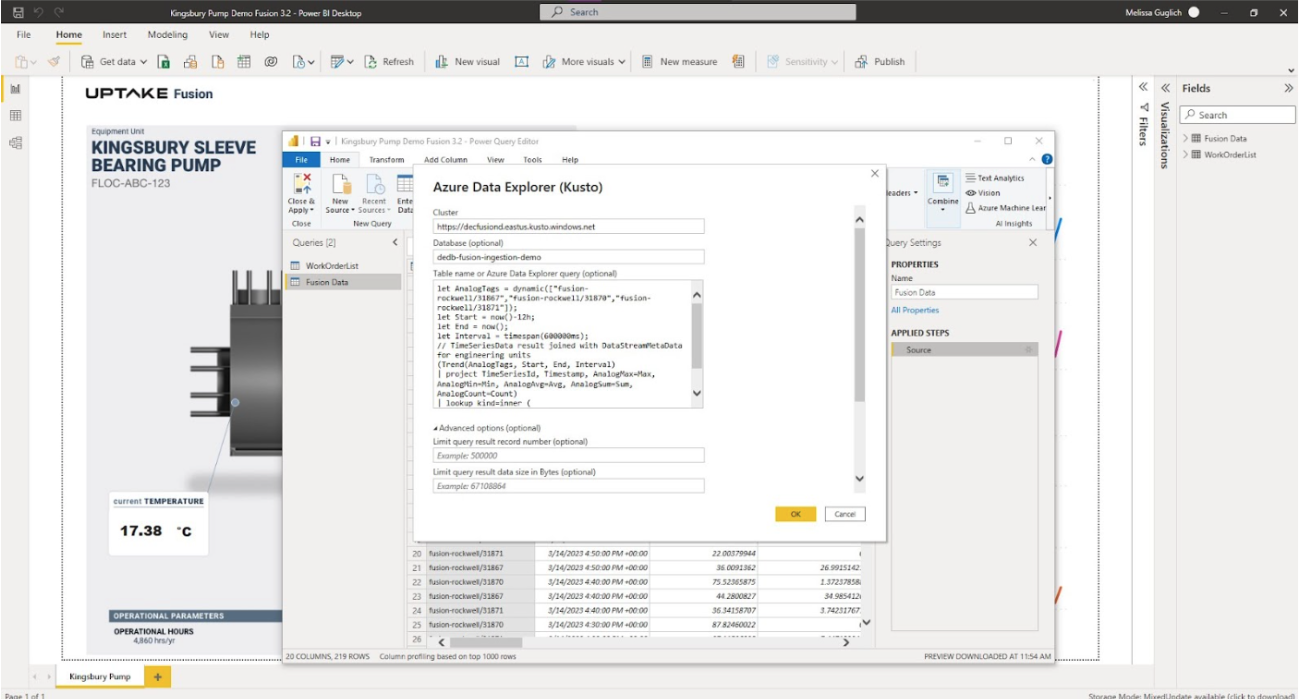
With Fusion, I can easily get access to data in a format that is ready to import into an analysis. I can export the values from the trender straight into a CSV, or better yet, I can prepare a query that I can use in any off-the-shelf analysis tool that I want such as Microsoft Power BI or Tableau.
I’m going to add my data directly into Power BI. The Export KQL tool inside Fusion lets me create a custom query. I just need to copy and paste the query, along with the server and database information, into Power BI and my data appears almost magically.
That was the most basic use case that we just went through, but for users that are willing to go a couple of steps further, and possibly learn a little bit about the query language, you can do so much more with your data preparation.
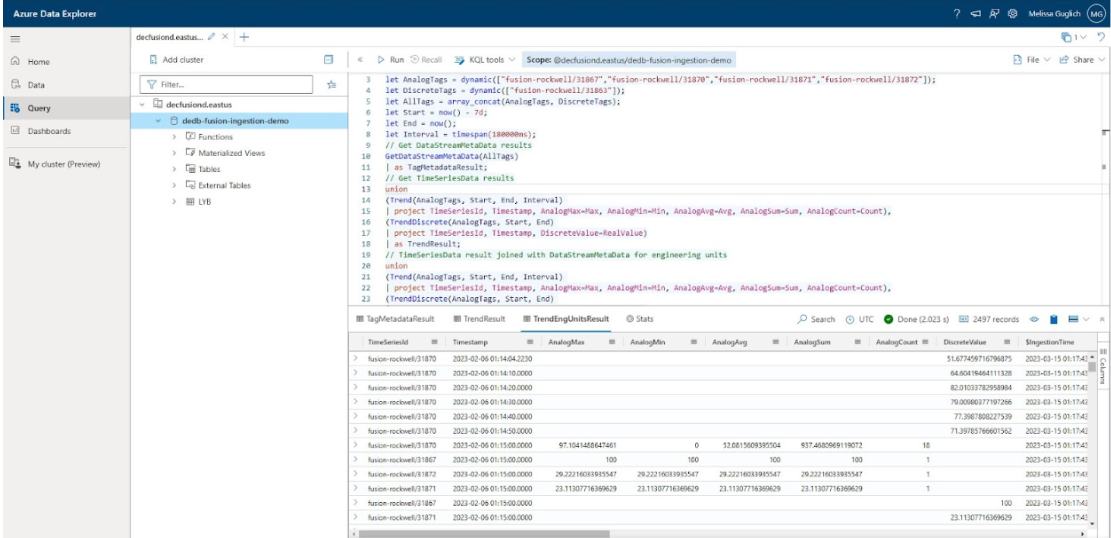
Fusion leverages KQL, the Kusto Query Language used by Microsoft Azure Data Explore. Instead of having to browse a model, you can leverage the powerful search functionality within Microsoft ADX.
The query I used in the above screenshot started off with
let AnalogTags = dynamic(["fusion-rockwell/31867", "fusion-rockwell/31869", "fusion-rockwell/31871"]);let DiscreteTags = dynamic(["fusion-rockwell/31863"]);These are unique tag identifiers that the Fusion Trender was able to provide. But instead of getting my list of tags from the trender, I might consider searching the data model based on conditions.
GetLatestDataModel()
| search "Pump" and "Flow Rate"
If you spend a little bit of time exploring the query language, you can really unleash the power of a good model. Filter your results to only include assets that are producing a certain product. Look for sensor data that has exceeded an alarm limit more than 10 times in a single day.
The last step is to use the self-serve analytics themselves to help analyze and narrow in on the data you are looking for. Learning a new query language can be challenging, but that’s why tools like Microsoft Power BI can leverage machine learning to let you ask the questions you want answers to … in plain language.
Self-serve analytics can offer many benefits for the industrial process control industry as long as we keep in mind the potential pitfalls associated with them. Organizations should carefully consider their specific needs and resources when deciding whether to use self-serve analytics over having trained data scientists perform the analysis. While self-serve analytics can be a powerful tool, it’s vital to ensure that users have the necessary skills and expertise to interpret the data accurately and effectively.
Ultimately, a combination of self-serve analytics and trained data scientists may be the best approach for many organizations. By leveraging the strengths of both techniques, organizations can maximize the benefits of data analysis and make more informed decisions to drive their business forward.
Fusion could be a great first step toward unlocking the power of these analytics.
I was fortunate to be invited to participate as a panelist at the ARC Advisory Forum in Orlando. This was in support of our client, Dan King, VP of Operations and R&D at Davey Textile Solutions, who also presented The New Digital and Connected Asset Management.

Prior to that presentation and panel discussion, we had the opportunity to meet with ReliabilityWeb’s Terrence O’Hanlon< and Maura Abad, where we discussed ReliabilityWeb’s Uptime Elements, which you see on the table in the picture below.

One of the most prominent digital transformation opportunities revolves around the application of analytics for predictive maintenance. The Uptime Elements provide a great framework to get things started to support the asset lifecycle from design to disposal/renewal.
One of the major hurdles that are often found in the ineffective design, standardization, and implementation of maintenance strategies. Organizations are jumping into Predictive Maintenance (PdM) strategies with the use of AI/ML analytics capabilities without having well-established condition-based monitoring strategies for their critical and auxiliary assets in some industries related to the balance of plant (BoP).
It is often found that organizations are still running on Overall Equipment Manufacturing (OEM) schedules which are not optimal, as Dan King shared, and do not provide a good indication of asset health based on equipment utilization. However, shifting their entire maintenance strategy towards predictive maintenance can also result in high costs and waste implications as parts may be replaced or equipment may be maintained, repaired, or retired too early in their lifecycle. A framework like Uptime can help find the optimal maintenance strategy balance.
These optimal maintenance strategies can include the use of industrial data analytics for Predictive and Prescriptive maintenance. Through this framework, data strategies can mature and help transform data and knowledge into insights, and even wisdom to a great degree, as many of the promoted Uptime elements (graphic below), are considered best practices in the industry.

In a way, the Uptime framework follows the knowns-unknowns approach (see graphic below). This approach consists of mapping what is already known to build up the baseline knowledge about the specific operations and assets, e.g., critical assets, failure modes, tasks, and activities, including frequency of inspections and type of inspections or online condition-based monitoring applications. With this baseline, gaps and opportunities can be identified – are adequate tasks executed at the proper frequency for the right duty cycle? Are proper online instruments, sensors, and analyzers implemented?

In the case of Uptime elements, this is accomplished using tools like Criticality Analysis, Reliability Engineering, Root-Cause Analysis, and Reliability Centered Design, among others. This helps establish proper maintenance strategies, including condition-based monitoring for those critical assets and for known failures. As part of this process, opportunities, where Predictive Analytics can be implemented to improve anomaly and failure detections can be spotted. Typically, a hypothesis is defined for the development of algorithms which may include the need for new IoT sensors. The Uptime framework, at best, will help establish a good data strategy baseline, providing a great foundation for where to drive predictive maintenance initiatives.
Garbage in, Garbage out
Remember, most analytics projects fail because data is garbage or not enough data is available, so inventorying and assessing the industrial data is recommended before proceeding with any analytics initiative. We often see clients asking for predictive analytics using AI and ML to find that they do not have access to the data, the data is unavailable, the data is not trustworthy, or the data is not granular enough.
Beyond predictive maintenance initiatives
We often forget that reliability and maintenance and overall asset management are just some of the functions of any industrial operation. The opportunities for analytics can be applied in other parts of the operations to target drivers and levers related to energy, environment, process, production, quality, and among others. Many organizations are addressing industrial analytics use cases one at a time or in siloes. The knowns-unknowns is a nimble, collaborative approach and generic enough that it can be applied and complemented with other more specific frameworks such as Uptime. Operations Subject Matter, Analytics Technologies (AT), Operational Technologies (OT), and Information Technologies (IT) experts can work together to share what they know and do not know. It is recommended to work with cross-functional teams to identify 3 to 5 use cases across adjacent functions – asset performance with energy management, process optimization, and quality, as an example. This helps form a more robust and sustainable data strategy and architecture to identify foundational elements such as an Industrial Analytics Data Hub and Enterprise Data Lakes.
Leverage existing data with adequate granularity for more
For the most part, we see organizations looking to leverage the data, information, and knowledge they have already established in systems such as historians and start moving data into their cloud environment. The initial use cases mostly require just aggregated and/or interpolated data moved from on-premise systems to the cloud using Extract, Transform, Load (ETL), or batch interpolated processes. The reality is that as they progress on the journey of industrial analytics innovation, they will find that the granularity of the data is not enough, they need streaming data as well, or they are missing data to support other additional use cases such as the development of soft sensors or new control algorithms.
Missing data !!! You are not alone !!!
It is not out of the ordinary to find many brownfield industrial operations facilities that have not been designed with an overall digital strategy in mind. These facilities may be operating without adequate instrumentation, sensors, and analyzers to support the various target value drivers and levers, or perhaps the instruments have not been integrated into historians and operations management applications, so they remain stranded. Using the knowns-unknowns, gaps, and opportunities can be determined, including new IoT sensors when data is not already available in historians and/or control systems layers. IoT sensors need to be administered, monitored, and maintained as well which adds to the Total Cost of Ownership (TCO).
IoT Sensor and Device strategy requires careful consideration
There is a tendency to jump into purchasing IoT sensors and devices that will allow them to get access to missing information.
The IoT sensor market is very interesting because even though there are “standards” such as MQTT, OPC-UA, Modbus, DNP3, and IEC, the reality is that the environmental and operational requirements need to be considered. For example, some IoT devices that may communicate via wireless cellular networks may not comply with bandwidth requirements of regional jurisdictions, other devices may not be intrinsically safe, and others may require repeaters due to electromagnetic fields interfering with communications, and others in very remote areas with difficulties for power may need a different strategy such as LoRaWan, and even Bluetooth in explosive areas.
It is recommended to validate the operational environment, such as power and communication constraints, that will help select the fit-for-purpose IoT sensor and device supplier(s). A supplier that provides a publish/subscribe API for data ingestion is recommended.
Leverage fit-for-purpose partners as required
Some OEMs are now offering new pieces of equipment with embedded sensors and IoT gateways to communicate directly with their cloud, but for existing equipment, this may require retrofits or replacements. IoT platforms may offer edge gateway aggregations with mostly fit-for-purpose sensor capabilities that may not be adequate for every operating condition and application. The truth is that multiple of these IoT providers will be required to support various parts of the business operations. Oil & Gas upstream environments are much different than downstream or midstream.
Some service providers, such as Drilling companies, may implement a holistic sensors and instrumentation strategy to provide aggregated data and insights as a service for specific types of applications. Check Use Case #1 Fracking Monitoring application as an example
There is no wrong or right answer. Just be aware there is not one platform in the market that can manage them all for the various applications. Every IoT platform will manage firmware and software upgrades for each of the devices under management. This needs to fit the overall data strategy and architecture as those insights need to be collected for better analytics across the value chain.
The world of industrial analytics is just getting started, so we need structured frameworks to guide requirements. The known-unknowns approach is a good way to map those requirements for digital and analytics initiatives. It is based on 4 major stages or phases depending on the magnitude of the initiatives:
For the most part, these events are already captured as parameters in historians, control systems as time series, and/or alarm and events.
With this, a good baseline data strategy can be formed to help assess data readiness for the use case in mind. This includes the quality of the data. It also provides an initial foundation for gaining visibility of the current state and conditions for monitoring metrics and KPIs to support the specific value levers.
Move into knowns, unknowns: it may be seen as baby steps. This consists of identifying events that are known, but there is not a consistent data-driven explanation as to what may have caused it and/or how to prevent it. Start by formulating a hypothesis that may lead to missing data and may require collecting data from PLCs, RTUs, or even new IoT Sensor Devices such as video and audio, to name a few. Understand the environment and operational conditions that these sensors and devices need to meet, especially on the communication bands, enclosures, resolution, bandwidth, and power constraints existing in the field.
At this point, the journey of building some anomaly detection and/or failure prediction models or identifying companies that already have commercial off-the-shelf products that include reliable analytics.
Consider getting access to the results and supporting evidence. Even though they may indicate that an issue may arise, this does not mean that action needs to be taken. Those insights need to be placed within the context of the operations and priorities, such as financial, people, and equipment availability.
Fusion has been designed as an Industrial Data Analytics Hub to support the known-unknown approach described above. Fusion can start by consolidating existing industrial data in historians and other operations management systems.
If data is missing, Fusion can acquire industrial data from control system level systems and/or ingest data from IoT sensor devices in the field or provided by service providers. As required, data from various sources can be segregated or amalgamated by independent sites or a group of sites so data can be shared across. All data in Fusion can be accessed securely by the various analytics teams and applications across organization functions – maintenance, process, engineering, quality, environmental, etc. All within the boundaries of our client’s cloud environment as part of their data strategy
Analytics results can also be ingested and stored in Fusion or on clients’ data lake via Fusion to ensure that all relevant data to support prioritization of activities and actions get dealt with accordingly and or to support other downstream enterprise analytics applications for value chain and supply chain optimization.
Fusion empowers organizations to have full control over their data strategy first. Yet, it allows data to be shared with third-party analytics SaaS providers (e.g., Snowflake, OneBridge, Seeq, Cognite).
Recently, I attended the ARC Advisory Forum in Orlando, Florida. I found it to be is very reassuring that the vision and mission we are addressing with Uptake Fusion as an Industrial Data Analytics Hub is well recognized in the Energy and Manufacturing market.
Our client Phillips 66, was able to present in the “Future Is Now: It’s All About the Data and User Experience” facilitated by Janice Abel from ARC. Abel began by sharing a few graphics highlighting the need to change how we approach Industrial Data and Analytics.
Abel stated that 85% of the installed base of data historians and data platforms were on-premise systems in 2021. However, that cloud technology will be the fastest moving in the next five years. We see this firsthand across the industries we serve – Oil & Gas, Refining, Chemicals, Power Generation, Pulp & Paper, Textile, and Water Wastewater, as portrayed by the graphic below from ARC:

According to the IDC article – IDC Future of Operations Survey data, the potential for cloud technologies to break down silos and enable more contextualized views of data is dramatically impacting enterprise investment priorities for operations.
“A point of resistance just a few years ago, organizations are now prioritizing investments and building strategies for putting operational data into the cloud,” said Leif Eriksen, Research Vice President of Future of Operations. “And, while the momentum is irrefutable, organizations will need to develop a specific cloud data management strategy that addresses organizational needs and objectives.”
To contrast this with some of our findings is depicted in the graphic below.

Despite the efforts in the last 20+ years provided by data historians and other traditional data platforms (white boxes in the graphic above), we still see Operational Technologies (OT) data being locked in silos and inaccessible to the broader audience. As well as found that a small percentage of this data is used in meaningful activities. These challenges are becoming more prominent as analytics prioritizes our clients’ digital transformation strategies.
Furthermore, based on the state of data science report published by Anaconda, we still see that about 45% of the data science and analyst time is spent getting data ready (loading and cleansing). The graphic above highlights the need for a step change to help us bridge existing gaps and prepare us for more sophisticated analytics with higher data fidelity and complexities.
Many traditional historian suppliers have been acquired by large automation conglomerates. They have shifted their direction towards SaaS-based offerings and cloud/edge-based analytics with new requirements. Most of them are no longer agnostic nor implemented on clients’ cloud environments, which reduces companies’ ability to freely monetize their data with their value chain and supply chain.
As depicted by the graphic below, digital transformation journeys will require organizations to define a vision and goals so they can associate opportunities and use cases with business value. Based on our experience, every department and function will have different use cases that impact different personas’ decision-making and workflow interactions. As found by our client Phillips 66, the systems involved in supporting many of those use cases are mostly the same, with slightly different data volume, latency, aggregation, and granularity datasets requirements.

As Janice Abel shared, industrial data’s complexity is continuously expanding from structure process data to multi-dimensional, unstructured, geospatial, and 3D. There is not one single supplier that can do it all.
In order to address the variety of use cases, this is an ecosystem play. Operating companies need to conclude that they will get exposed to various suppliers who will want to collect data from the field, and operational systems and deliver insights into what they are good at. These operating companies will also be exposed to a variety of SaaS-based applications that need access to the same data as others.
Yet, these operating companies also need to realize that they need to serve the needs of their internal organizational sites, departments, and functions. Each of those organizational levels may define a different application strategy, they may decide to build their own applications to fit their business processes (KPIs, dashboards, reports, analysis, workflows), or they may go with more standard supplier-provided pre-packaged SaaS application offerings.

In order to prepare for the future, although it may seem uncertain, it is imperative to establish your data strategy first, gain control over your data and then decide who/how data will be shared and accessed by different parties in your value and supply chains. A B2B or B2C partnership with a SaaS Provider and/or a client is great consideration but keep in mind that this is not a one size fits all approach, so you are mostly going to need commercial partnerships with multiple suppliers (OEMs, Service Providers, Analytics application providers), especially with those suppliers who offer pre-packaged SaaS solutions. This will help accelerate the time to value while reducing the Total Cost of Ownership (TCO)s.
To put this into context, one of our Uptake clients established a commercial agreement with a SaaS Pipeline Integrity application rather than developing a completely new set of capabilities on their own. Uptake Fusion was able to share a large aggregated dataset residing on our client’s cloud environment to deliver 2+ years worth of granular data of our client’s pipeline network segments to the SaaS Pipeline Integrity provider, OneSoft OneBridge – read more.
With this approach, our Fusion client has established a much more flexible method to share data with internal and external parties. Some, such as Onebridge, may require larger aggregated data sets, but others will require more granularity, especially as we see more analytics applications moving to the edge towards driving more automation at the equipment and process level or semi-autonomous requirements with operator guidance applications and in the future fully autonomous and self-adaptive systems. Another similar use case example relates to Fracking Monitoring Activities – learn more.
In summary, its crucial operating companies establish their own data strategy first.
By doing so, you gain from a flexible model that will allow you to support the various use cases; some may be better with an internal development strategy that drives Intellectual Property(IP) differentiation, but others may be accelerated with commercial off-the-shelf SaaS applications. As depicted by the picture below, that is the great value cloud offers which includes enabling new ways to operate and establish new and better business models with suppliers and/or customers.

As per the image above, are you ready to get fit and stretch the value of your Industrial data? Start with Fusion, an industrial data analytics hub that helps you gain control over your industrial data so you can have the flexibility to accelerate your analytics initiatives and decide how to best maximize its monetization as part of your overall data strategy from your own cloud.
Thank you for your time. We will share more market needs and how Fusion supports those needs.
CHICAGO, USA — March 14, 2023 — Uptake, a leader in predictive analytics software-as-a-service (SaaS), today announced the release of Fusion 3.2, enabling self-service industrial dashboards.
Uptake Fusion 3.2 now includes a very easy to use Export Query capability. Users can now come into our trender, add the tags they are interested in, configure the date range for their analysis needs, and export a query that automates data import into any application. The query automatically pulls the most current data anytime it is utilized by the application. No coding skills required.
“The data in Fusion is most valuable when users are able to access it in whatever application they want. Our new Export Query feature, relieves IT from having to build dozens or hundreds of different dashboards. With a few simple clicks, individuals can build a dynamic data feed that fits their application needs, unleashing the power of citizen data scientists across the entire organization.” Dave Shook, Chief Data Officer, Uptake Fusion

Export a query from inside the Uptake Fusion Trender

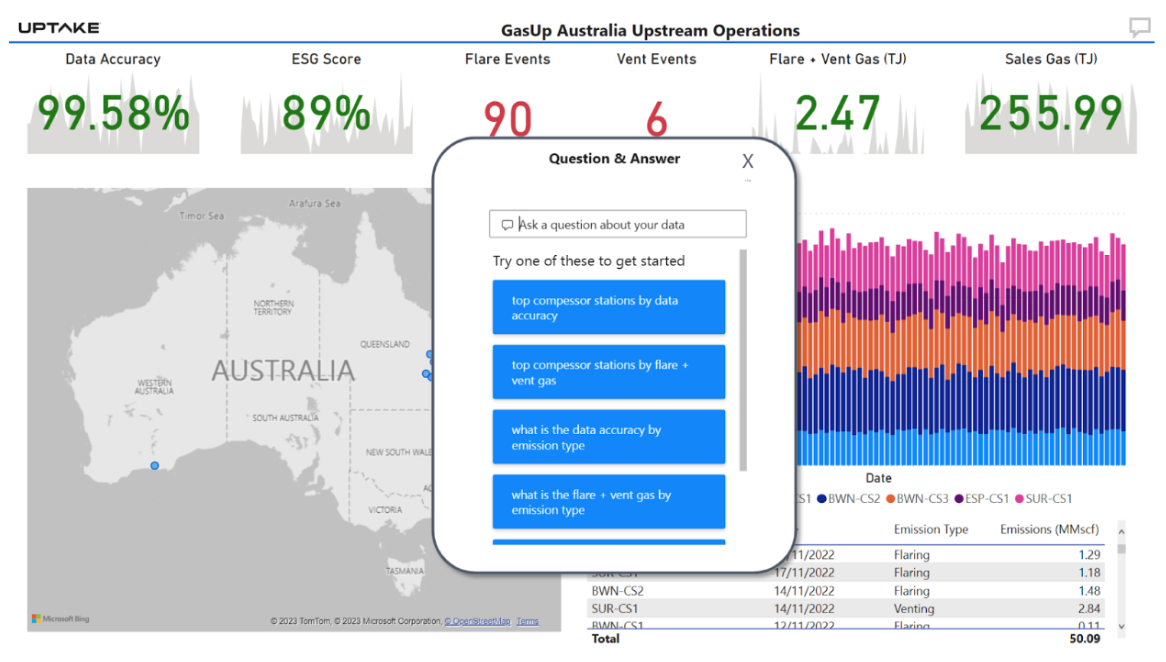
Paste the query into any analysis tool such as Power BI
Uptake is a leader in predictive analytics software-as-a-service (SaaS), working to translate data into smarter operations. Driven by industrial data science, Uptake enables and delivers actionable insights that predict truck and component failure, optimize parts and maintenance strategies, and visualize cost information with more than 45 patents, almost 200 data science models, and recognition by Gartner, Verdantix, the World Economic Forum, CNBC, and Forbes. Uptake is based in Chicago.