As with any heavy asset, turbines are less productive the more they are used. That simple fact of aging is taking on new resonance in the North American wind industry, where the average age of fleets is estimated to rise from 7 years old in 2020 to 11 in 2025 and 14 in 2030.
With many operators now having expanded their installed capacity and conducting maintenance for the first time with service in-house, the management of aging turbines may come as an organizational first. OEMs, independent service providers, and many of the larger owner-operators have managed turbine performance decline before, but not like this new maintenance landscape ahead, with new turbine makes and advanced controls technology still untested by the usual wear and tear.
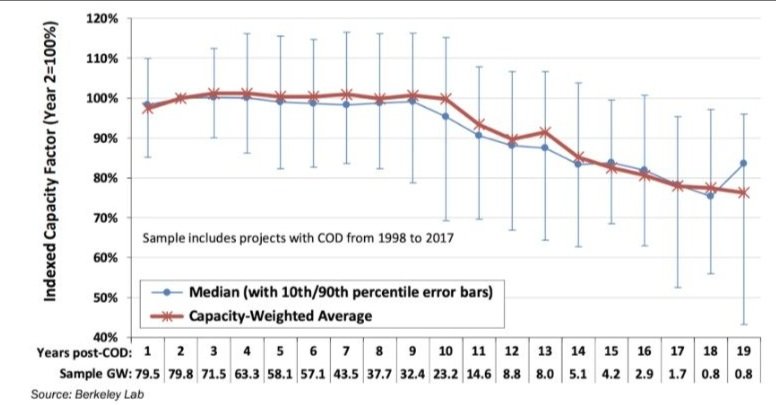
After accounting for the “teething” issues in years one and two because of site configuration and maintenance strategy adjustments, the Berkeley Lab found turbine performance decline to be linear in a survey of the North American fleet. This gradual loss of output productivity is consistent across turbine makes and models.
For pre-2008 sites, this annual decline in output equals about 0.53 percent. Newer turbines with a greater blade-to-generator ratio installed at post-2008 sites, by comparison, are holding up better so far. They’re losing on average about 0.17 percent in output each year.
These newer turbines are also contributing to the expectation of a longer turbine lifecycle, from around 20 years in the early 2000s to an expectation of 30 years today, according to a recent survey of wind executives.
Despite the improved lifespan and maintenance programs for repowered turbines and newer sites, the tenth year remains a critical point in the turbine life cycle. Between the tenth and eleventh years, the
Berkeley Lab found that output productivity slipped for older sites by about 3 percent. The extent of that drop off for newer sites is still uncertain, but ten- and eleven-year-old sites have so far underdelivered on their productivity projections, suggesting that the drop off continues still.
Performance drops off for a few reasons around the tenth year — some of it attributable to technical and normal mechanical degradation, but much of it the result of market incentives and controlled wind farm operations.
1. Component Replacements: The replacement of key components like gearboxes (which alone explains about 30 percent of total performance decline) introduces some of the same teething problems around turbine and site configuration in year ten. After the second bout of component optimization which follows, turbines recover some productivity into their second decade before falling off once more. As many executives project operating turbines into a third decade, it is possible that another round of component replacements and a third set of teething issues may realize another drop off and slight recovery.
2. Expired OEM Warranties or Service Agreements: When operators bring service in-house, cost-effective maintenance — especially for underperformance — typically becomes less of a priority. As we’ve written before, the wind industry has historically treated downtime as more identifiable, measurable, and addressable, which accounts for why underperformance issues become more challenging to document, investigate, and fix as maintenance moves in-house.
Without due correction for underperformance, the revenue left on the table is significant. The Electric Power Research Institute estimates that just a 1 percent boost in productivity at a typical wind farm with 100 two-megawatt turbines would increase revenue by $250,000 – $500,000.
3. Productivity Goals Framed by Power Purchase Agreements: A power purchase agreement (PPA) often determines the span of peak productivity and the associated maintenance strategy at a park. Similar financial instruments to hedge risk in wind operations like Proxy Revenue Swap Financing, which exchanges the expected value of power generation for fixed payments from third parties, encourages more moderate approaches toward power performance.
Whether a PPA benchmarks on both availability or performance, hitting agreed-upon output without exhausting non-PPA productivity can see varying drop-offs depending upon the length of the PPA.
4. Slowdowns Incentivized by the Production Tax Credit (PTC): As sites lose eligibility for the PTC in their tenth year of operation, performance declines by about 3.6 percent. Losing the 1-2 cents per KwH writeoff encourages more moderated power performance becoming the norm in order to stretch out mechanical stress and pre-empt costly failures and subsequent replacements on turbines that have already been repowered.
In Europe, where a PTC equivalent is not available by kilowatt-hour, wind farms have operated with a more gradual linear rate of decline, without the sharp decrease in year ten. Similarly, upon expiration for the Treasury Department’s lump sum 1603 Grant, wind projects dropped off at 3.2 percent. Instead of pursuing vigilant maintenance on turbines at peak performance, projects took a more measured approach and saw a less steep decline in year ten.
Into the second decade of the turbine life cycle, when “teething” issues again subside, performance decline slows and averages about 1.23 percent annually for the rest of a turbine’s lifespan. By year seventeen, older turbines installed in the 1990s and early 2000s have averaged 87 percent of their peak productivity. Younger turbines now appear that they will age more gracefully, though to what extent remains to be seen.
Capitalizing on heavy investment in wind turbines requires cost-effective upkeep. Repowering initiatives are just one step in an O&M approach to stave off productivity declines. And as performance decline draws greater attention with the demand for carbon-free energy increasing, caring for an aging fleet through power performance will be fundamental to the long-term profitability of wind projects.
Many owner-operators have accelerated their digital transformation of maintenance activity due to the COVID-19 pandemic. Remote plant monitoring and staggered technician scheduling, for example, rely on digital solutions to ensure continuity in operations, as well as to protect the health and safety of frontline operators and maintainers.
Industrial intelligence is another key part of this digital adaptation. Analytics powered by the combination of data science, industry experience, and subject matter content are forming the foundation of operational excellence.
This past year has also shown the limits to digital adaptability. The financial pressure of the downturn has left many businesses grappling with fewer resources to develop their own internal analytics programs. At the same time, the transition has shown organizations that they’re able to adopt and implement digital solutions without the headache of significant change management.
In turn, we’ve seen a greater focus on analytics, the limited resources to develop them, and as a result, the growing gap to address that need.
It wasn’t just owner-operators who felt the resources bind this past year.
Various players in heavy industries have common challenges to address, including talent shortages, the so-called “silver tsunami” as a generation of experts retires, greater compliance obligations to regulatory boards, legislators, and industrial partners, and the need to harness the power of vast amounts of data from disparate sources and convert it into a usable format.
OEMs, faced with these industrial challenges, increasingly tapped analytics as a way to set apart equipment offerings. The same goes for independent repair shops and their services in industries like trucking, which are adopting more advanced maintenance strategies to set themselves apart in an increasingly fragmented market for repairs.
The impact of these challenges looks different in each type of organization. Whether they’re original equipment manufacturers (OEMs), owner-operators, service providers, or analytics companies, their responses are shaping how the market meets the acute need for analytics.
In parallel with this trend towards analytics has been the development of industrial connectivity, or the Industrial Internet of Things (IIoT). OEMs have pursued connectivity on assets like turbines, trucks, rolling stock, and power transformers. Native edge devices, wireless connectivity, and cloud software have sped up OT/IT convergence for long-established customer relationships. As embedded software distinguishes OEM hardware offerings, IIoT capabilities have opened up the possibility for better analytics.
Machine owners and operators, wanting to cut maintenance costs and improve repairs and take advantage of connectivity, have expressed a need for industry-standard analytics. Since many have a number of OEM relationships, they have reached out to third-party analytics to prepare data from mixed asset types and manufacturers. That way, they have standardized recommendations on how to precisely operate and maintain their unique combination of equipment.
For their part, OEMs have used third party analytics to improve equipment offerings and service obligations. Winning more business from operators with mixed equipment by making inroads to capture more of those assets in the future relies on the current interoperability of analytics solutions, both among connected assets and within an organization’s tech stack. OEMs, shut out of the proprietary information of other manufacturers, often have to turn to third-party solutions to pave a future path toward equipment competitiveness.
As solution providers scope out specific use cases from various OEMs in different industries, the scale and independence of third-party analytics promises the industry standardization and warranty mediation that owners and maintainers of equipment seek.
We’ve seen this dynamic play out in the wind industry. More precise conditioning monitoring can substantiate the root cause of pending turbine failures and validate claims of warranted service. With a single, shared source of industrial intelligence, third-party analytics solutions are helping industry players enter into service agreements that better reflect performance. Parties to the warranty don’t have to overhaul existing workflows to integrate third-party analytics solutions or allocate a significant part of their budget.
This dynamic has particular relevance to the wind industry right now. As investment pours into renewable energy generation, many operators have grown their operations and now have the scale to make in-house maintenance more cost-effective than turning to an OEM or independent service provider. Woods Mackenzie estimates the share of OEMs conducting maintenance on wind turbines will fall from 64 percent in 2018 to 50 percent by 2028.
Without the analytics experience to carry out the responsibilities of engineering and maintenance teams, operators are looking to analytics to manage performance — especially given the industry’s technician shortage and as many conduct maintenance in-house for the first time.
In a broad range of heavy industries, operators, OEMs, and service providers have realized significant operational efficiency from analytics solutions.
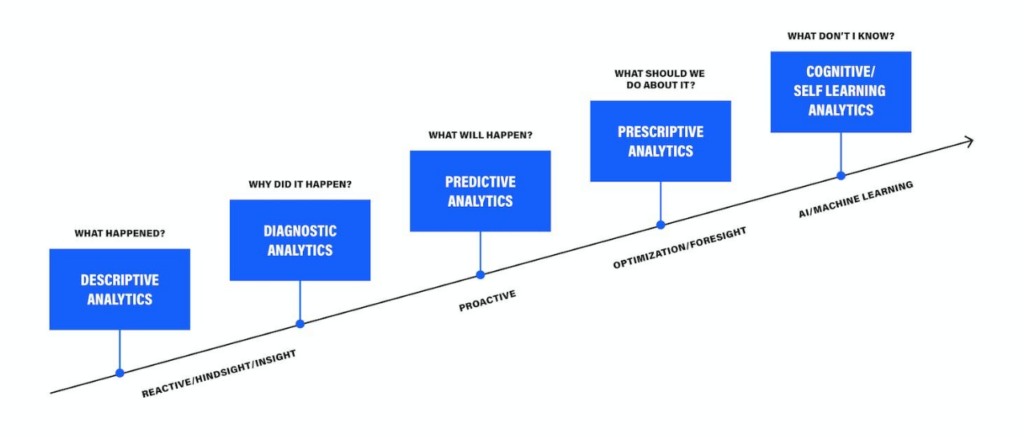
Not all analytics are created equal though. Different levels of analytics — descriptive, diagnostic, predictive, prescriptive, and self-learning — have corresponding degrees of improvement in O&M efficiency. We’ve seen all types of market players capitalize on the value of their data, from early tech adopters building out their own analytics infrastructure in concert with third parties to those looking to leverage external solutions entirely.
Solution providers will fill the analytics gap that last year widened, and the sharing of data and leveraging of connectivity will determine the pace at which the digital transformation of maintenance happens. In 2021, the promise of industrial analytics to make a bottom-line difference will entail more direct cooperation among owner-operators, OEMs, service providers, and solution companies.
When industrial leaders consider AI-driven predictive maintenance solutions, most choose one of two paths:
Generalized platforms that enable do-it-yourself (DIY) Machine Learning model-building — like AWS SageMaker or Azure Machine Learning Studio.
Dedicated, industry-specific applications with pre-built data science models that offer AI-enabled insights.
The decision between the two is more complex than the typical app-versus-platform selection process. That’s in large part because, as it’s emerged, Industrial AI has developed along one of these two paths. Many industrial software companies operate from a place of either deep immersion in one specific industry or a generic approach to asset-intensive industries, and their products reflect this either-or legacy.
For example: if you take a look at the recent report from Gartner on asset performance management (APM) software, you’ll see this categorization of vendors as an “asset analysis product” or “APM platform.” That’s because, to date, most vendors have presented these two configurations as exclusive options to asset-intensive operators, service providers, and OEMs.
It’s a false and oversimplified choice — industrial leaders must be equipped with hybrid solutions that combine the benefits of both approaches and address the gaps in each.
When a leader asks her team for recommendations on Industrial AI solutions, preferences often land in one of two camps: Chief Digital Officers and data scientists tend to like platforms, because they provide technical toys to play with, in-the-weeds-level control over eventual solutions, and likely more credit for business outcomes that the AI initiatives achieve. As generalized industrial platforms, they’re built with a birds-eye view toward enterprise-wide initiatives.
Asset managers, reliability engineers, and other operations leaders, on the other hand, usually want dedicated solutions. Like pre-Moneyball baseball scouts, they doubt algorithms can tell them something they don’t know about their assets — unless the software company selling them has industry credentials and its own in-house subject matter experts (SMEs). As industry-specific applications, they’re built with a narrower concentration on asset-specific maintenance activity.
In reality, both approaches carry significant downsides.
The greatest strength of generalizable AI/ML platforms, their configurability, is also their greatest weakness. In order to provide value for data scientists in sectors from marketing to manufacturing, they rarely offer the level of depth that accelerates speed to value in specific industries. For instance, a general platform cannot provide relevant additional information (such as benchmarks of peer customers’ asset or faults data), or a broad set of pre-built AI/ML models (like anomaly detection for a stamping press). And they might hamper additional, industry-specific plug-ins down the road because of short-sighted platform development.
Most Industrial AI applications, on the other hand, are limited by their depth and specificity. Heavy equipment companies own and operate broad sets of assets, and buyers and users alike prefer a single screen to manage and monitor everything in one place. On the part of operators, having multiple vendors becomes unwieldy and undermines enterprise-wide clarity and agility around asset classes. They’re pressed to pick and choose use cases for AI with the most determinable ROI rather than the broad deployment that can modernize maintenance and drive digital transformation.
Even sectors like power and utilities boast a diverse set of assets and use cases (e.g. renewable generation, transmission, thermal generation). This industry-specificity can require expensive customization to expand from a company’s core product, or a mix of point solutions that need to be checked individually to get a view of the whole enterprise.
As a result of these challenges to each approach, we’ve seen the Industrial AI sector — both in customer demand and vendor offerings — moving towards a hybrid model.
On a more technical level, this mixed approach combines data mastering and metadata-driven app development. Data ingestion isn’t just following a niche procedure because it’s from one system integrator or another. Instead, it’s a reusable and therefore scalable framework that accounts for the type of connection (API, FTP, etc.); component (e.g., a diesel engine, regardless of the asset it’s powering); data density and velocity; and available signals as mapped to a standardized, OEM-agnostic set of channels.
This process, when coupled with a framework and set of ML templates — like anomaly detection, failure prediction, and fluid analysis — speeds the configuration of models, often with the help of SMEs at the customer. It also makes application deployment for a variety of assets and similar use cases much easier, because implementation teams can edit a text JSON file instead of writing brand-new code. In addition, this hybrid approach enables the mixed approach to quickly incorporate contextual data sources like weather, as relevant to customer needs.
Fusion created a purpose-built platform with this strategy in mind, accelerating our ability to configure and deploy AI-driven predictive maintenance applications across a variety of sectors. Using our Digital Industrial Library, Uptake deploys pre-trained models to new assets, cleans and organizes enterprise asset data, and then fine-tunes our data science models to deliver insights that quickly realize value for our customers. We’ve honed this process of deploying models to new asset classes, and our work with General Motors iterated this framework to prevent failures on automotive stamping presses.
Check out this video for more on our work with GM:
While this shift in the market is in its early phases, it’s a strong indication that vendors are giving customers what they desire. The success of Industrial AI, and its ability to impact the bottom line of asset-intensive industries, rests on our ability to strike the optimal balance among configurability, specificity, usability, and knowledge.
Underperformance of turbines remains one of the biggest challenges to operators of wind fleets. Most operators are still relying on legacy power curve-based techniques to address underperformance and have no automated way to drive revenue growth through improved turbine performance.
Reliance on traditional underperformance identification costs many operators up to 2 percent of their annual energy production (AEP). The Electric Power Research Institute estimates that just a 1 percent boost in productivity at a typical wind farm with 100 two-megawatt turbines results in revenue increases of $250,000 – $500,000.
Knowing that operators lose significant revenue due to underperformance, we’ve set out to explain why power curve-based techniques are leading to performance management strategies that fall short.
Power performance approaches are primarily based on the manufacturer’s design curve. If a turbine falls below an OEM threshold, reliability teams can only sometimes filter out likely reasons for underperformance including curtailment, icing, and anemometer degradation. This approach presents several problems:
1. Power curves can’t capture the full operating context
The design curve is based on the performance of wind turbines located in an area with minimal turbulence and average head-on winds. Factors that make up the total operating context — like confounding variables of air density, wake effects from turbine arrangement, or hilly terrain — are missing from the manufacturer’s curve that operators use to track underperformance.
By not accounting for these variables, operators get a partial and misleading picture of performance.
2. Power curves are turbine-specific, not operator-friendly
The OEM curve is a forecast of performance for a specific set of turbines. Over time, turbine models under management change. Site to site, and with regular redesigns and repowering, performance benchmarks that are tailored to specific power curves become a site’s model for power performance management.
With repowering and development initiatives, rendering analytics from one make or model of turbines to another becomes another important way to sustain productivity and build internal best practices around power performance management. Operators shouldn’t have to fall behind or re-train reliability teams when they buy more durable, better-performing turbines. Power performance management should have the flexibility to adapt with procurement and personnel decisions.
3. Power curves aren’t linked to value impact
The design curve is a technical reflection of what’s going on — it abstracts turbine productivity from business goals around preventing downtime, driving productivity, and performing cost-effective maintenance. For power performance management to earn enterprise-wide buy-in, operations and maintenance teams must have a shared understanding about the impact of specific underperformance issues on revenue.
These problems stick operators with alerts that make power performance a burden — on average, design curves deliver true positive alerts only 4 percent of the time. Because of this imprecision, performance and reliability engineering teams pour more time and money trying to isolate and understand true cases of underperformance.
Often, they cannot provide enough evidence to enable action or manage service providers, because they’re preoccupied with availability issues and already facing torrents of data at their sites. Power curve-based alerts aren’t reliable to maintenance teams, either. False positives often just turn up skepticism about future service requests.
In the event engineering teams can pull together evidence from an alert to enable service providers to take action, it becomes challenging to prove the importance of underperformance in dollar values. Performing service on underperformance at the right time demands that it’s prioritized among other competing maintenance issues.
Traditional underperformance techniques aren’t powerful enough to optimize maintenance and help wind operators get the most out of their turbines. The solution? AI for power performance gives engineering and operations teams a shared and precise view on how to optimize maintenance for underperformance issues based on root cause. That way, there is clarity about the bottom-line impact of addressing underperformance at any given time, and supportive evidence that enables smarter decisions and faster action.
Analytics for the wind industry have long leveraged data to generate insights on downtime. With advances in AI, wind operators now have an opportunity to more effectively address underperformance, yielding production increases not possible with reliability models alone.
Traditional turbine monitoring providers have focused analytics on downtime for several reasons:
Downtime is identifiable: Downtime is easily detectable and understandable, thanks to improved classification systems developed in anticipation of NERC-GADS. Underperformance, however, is more difficult to spot — especially with traditional power curve techniques that have a high signal-to-noise ratio.
Downtime is measurable: Most warranties set targets for downtime rather than productivity, partly because it’s inarguable whether or not turbines are running. Given those incentives, service providers are more likely to take action on downtime, and the software they build and buy reflects that reality.
Downtime is addressable: Major component failures eat into availability, are expensive, and jeopardize planned maintenance. As many owners move out of warranty and self-perform their operations and maintenance, they’re taking reliability even more seriously than they were before.
Reliability analytics have accelerated availability improvements across much of North America and Europe, with a typical wind owner now operating at 96-98 percent availability. In addition, with the Production Tax Credit-driven development and repowering of the last few years, availability has become a lower priority.
The Opportunity for Power Performance
As a result, many operators have turned to performance optimization as a high-priority area for operational improvement and production gains. In its engagements with customers, Uptake has found that many operators have room for as much as 2 percent in increased annual energy production (AEP). Since lost AEP issues are often trends across several turbines or event sites, gaining insight into root causes of underperformance like turbine derating or yaw misalignment can provide outsized production increases.
Challenges with Underperformance Analytics
Simple analytics approaches identifying underperformance monitoring often fail to provide ROI. That’s because most rely on the manufacturer’s design curve, not taking into account confounding variables like icing and constrained operations, or even anemometer degradation. These approaches generate true positives about 4 percent of the time; busy performance engineering teams don’t have time to sift through hundreds of supposed underperformance alerts. Even with accurate alerts, engineers can struggle to prioritize underperformance issues among individual turbine issues and system improvements — especially based on value.
Advanced analytics holds significant promise for addressing these challenges by benchmarking a turbine’s current production against historic performance and peer turbines, as well as the power curve. AI-powered automation and access to deep supporting evidence on underperformance issues can also help identify root causes and develop a plan of action, whether it’s with internal operations teams or by stronger service provider management.
For most wind owners, performance and availability are two key pieces of their wind engineering and operations decisions. Unless they have high-quality analytics insights to inform both, they’ll continue to leave megawatt-hours — and, consequently, revenue — on the table.
Here’s why: when someone compares data to oil — a conference-keynote favorite — it brings to mind the image of crude gushing out of a derrick. The reality of data science looks a lot more like the production of shale oil, which sits between layers of shale rock and impermeable mudstone and is obtainable only by fracking — fracturing the rock with pressurized liquid.
For all the transformative potential of industrial AI, most big data projects fail — just like ventures in the early days of fracking.
Estimates from Gartner place the failure rate of AI projects at 60 percent, with some sources like Pactera and Dimensional Research putting failure as high as 80-85 percent. Those estimates amount to $22- $30 billion pumped into failed AI projects in 2019.
That leaning into AI for digital transformation is not an easy or inexpensive project shouldn’t come as a surprise. What is striking is that the challenge isn’t often getting the analytics right — it’s the availability, quality, and management of data itself. Like shale production, data science is challenged by extracting, refining, and controlling the input that makes it productive.
There are three main problems data science and shale production share.
For decades, shale reserves in the United States proved so difficult to tap that many were left unrecovered. Heavy research funding from the Department of Energy (DoE) and Gas Technology Institute (formerly the Gas Research Institute) into fracking and horizontal drilling resulted in the development of commercial-grade technology, equipment, and machines. Only then, after decades of funding and testing, were operators able to tap into shale plays — locations known to have large shale reserves. It took these developments in drilling technology and infrastructure (first at known plays and then to others by way of geological survey) to grow extraction from these shale plays into nearly two-thirds of oil production and three-fourths of gas production in America.
Similarly, industrial information sits in hard-to-reach systems with wildly different conditions for extraction. Like geologic surveyors, data managers and product managers must identify powerful sources of data, whether they’re in current fields (like spreadsheets), yet-undiscovered fields, or previously known fields where technology now enables access (like the Internet of Things). Additionally, these sources of information maintain differently labeled and often partially-overlapping records. Within single sources, time-series data have inconsistent timestamps and data are frequently missing or filled with errors.
Metadata and quality variation within and across sources makes extraction for value difficult to standardize. The result is that a typical data scientist spends 80 percent of her time data-wrangling — cleaning, structuring, and enriching raw data until it’s AI-ready. At many large corporations, data collection and storage are so mismanaged that data science sometimes isn’t even possible. Gartner estimates that lost productivity due to poor quality data costs businesses 30 percent of their revenue on average.
Extracted oil is valuable as a commodity, but it is worth far more once refined into fuel, plastic, or fertilizer. Because of the lighter density and higher sulphur content of American shale oil, domestic refineries have had to adapt infrastructures traditionally suited to handling heavy crude. The global oil industry too has had to change, adopting go-to-market practices that process heavy oil to fully capture the value of available crude outside the United States. Both the existing refinery processes in the US and changing go-to-market practices worldwide have made refining shale more challenging, which is on average three-to-four times more expensive than refining crude for commercial use.
Likewise, raw data is far less useful than the insights derived from it. An enterprise must refine raw data, creating valuable intellectual property through a proprietary process, subject matter expertise, analytics, software, and the ingestion of unlike datasets. Although the soaring volume, velocity, and variety of industrial data have been a boon to AI, industrial leaders admit they’re struggling to implement predictive analytics solutions that generate sustainable value. Senior executives often lack the analytical expertise to manage strategic capabilities offered by data insights.
AI initiatives lag when different areas of the company have varying access to the data needed to make strategic decisions. Once developed, AI presents a similar problem of refinement from commodity into saleable product that lacks a mature market. In addition, this refinement for value must also be completed with an understanding of the ever-changing legal, regulatory, and contractual restrictions that bind the use of data.
Extracting shale has caused concern because of its release of methane gas, leaching into underground reservoirs used for drinking water, and triggering of earthquakes.
Data science raises its own issues, such as protecting data privacy, maintaining ethical algorithms, and ensuring cybersecurity. (And those are just the concerns if data science builds models that work as intended.) A survey from the open source data science platform Anaconda found that three-quarters of data scientists use open-source platforms, a third of whom say they don’t take deliberate measures to protect their work. When you’re relying on AI to help make decisions around infrastructure, a single malfunction, data leakage, or poor decision can lead to massive ill effects.
And, at bare minimum, mismanaged data quality leads to waste: about $3.1 trillion per year in the United States according to IBM.
None of these challenges are insurmountable. The emergence of shale production as a viable source of energy, notwithstanding its environmental and human health effects, holds promise for a data-driven economy with true grounding in insights from AI. Too often though, these challenges remain blindspots for industrial leaders who fail to recognize that data integrity is holding back their AI initiatives.
Ingestion proves the greatest challenge to translate data into insight, from turning readily available raw material into functional inputs and then finally into commercially-viable products. Only upon a foundation of clean, standardized, high-quality data will information empower leaders to survey the complete range of facts, ask the right questions, make decisions with total clarity, and consider the consequences of their decision. And only then can AI fulfill its promise to the industrial world and its customers.
…Even when the apparatus exists, novelty ordinarily emerges only for the man who, knowing with precision what he should expect, is able to recognize that something has gone wrong.
In my latest podcast episode of Core Insights, I (virtually) sat down with Professor Wolcott to discuss how Digital leaders can ensure success in the post-COVID world. We discussed several important topics such as Proximity, Periphery, and Agency, and how they are enabled by Industrial AI.
View the episode below. As always, I will be awaiting your feedback. Thomas Kuhn wrote this statement in his landmark book The Structure of Scientific Revolutions.
Although his comments were meant for scientific discoveries, the philosophy that the truth emerges more readily from error than from confusion, is highly relevant to the global pandemic our world faces today.
COVID-19 has highlighted the many failed digital transformation efforts across the globe—many efforts which have been a victim of confusion leading to dismal business results and a long list of failed projects. Harvard Business Review reports that in 2018, $1.3 trillion was spent on digital transformation initiatives, with an estimated $900 billion in waste with companies reporting that they didn’t meet their goals.
The current crisis has revealed that an unfortunate number of business leaders didn’t fully understand what was expected to digitally transform, and to make matters worse, most were ok not knowing and therefore delegating efforts to others within their organization.
We have been forced into a realization of a massive error that was in the making for years. These times have also uncovered what exactly businesses should expect from their digital efforts and how soon. In Thomas Kuhn’s words: “the truth will now emerge, if it hasn’t already, to the businesses.”
I engage regularly with leaders across the world and over the past four months, the conversation on digital has become significantly more meaningful and sincere than ever before. It feels as if there is a newfound sense of urgency and significance.
Professor Rob Wolcott rightly argues in his Forbes article that businesses have crossed a metaphorical (Digital) Rubicon River and they have a limited time to perform (or perish). Just like it was for Julius Caesar and his army, for businesses, it’s Rome or death.
Right now, critical electric infrastructure matters more than ever. And for wind power owners and operators, every megawatt hour of annual energy production is critical. That’s why forward-thinking power producers and utilities are building and buying analytics technologies. Yet all analytics aren’t created equal. That’s why we’ve created this simple guide to wind analytics, from the basic end of the spectrum to the most advanced.
Level 1: Business Intelligence. Often called descriptive analytics, these tools are crucial for reporting to senior management, and visualizing historical and near-real-time data. In wind, BI enables better understanding of causes of downtime and a clearer overall view of asset health.
Level 2: Rules & Condition-Based Monitoring. This group includes a range of technologies, from simple signal thresholds set by subject matter experts (SMEs) to advanced diagnostic tools that detect and identify abnormal activity across several inputs like temperature, pressure, and vibration. These real-time alerts can help focus reliability engineering and operations activity toward turbines with issues.
Level 3: Predictive Analytics. These provide alerts based on data signatures before a failure occurs, offering a level of specificity that enables action—not just investigation. Prognostics like this can prevent catastrophic asset failures and save operations and maintenance costs by allowing operations teams to plan more effectively.
Level 4: Productivity AI. Until recently, the wind data conversation focused largely on reducing downtime and predicting failures. Yet as availability increases across most fleets, challenges around power performance begin to matter more. Unfortunately, most underperformance detection has not caught up to the need, with typical models relying too heavily on the manufacturer’s design curve. Advanced machine learning techniques have recently begun to enable productivity models that:
filter out a variety of cases like icing and constrained operations control for confounding variables like wind direction and air density incorporate additional benchmarks like historical performance and data from surrounding peer turbines.
Level 5: Dynamic Maintenance. In a perfect world, asset management and operations teams would be able to combine all of the above to optimize in real time for O&M costs, AEP, asset life, and market demand. This is where we’re headed as an industry, but we’re not there yet. The good news is that owners can set up a dynamic maintenance framework now — incorporating insights from the best available analytics technologies to make decisions at the asset, site, and fleet level.
By following these simple principles, our wind customers have increased AEP by 2%. Get a free assessment of the value at stake for your wind sites.
CHICAGO — DECEMBER 6, 2022 — Uptake, a leader in industrial intelligence, today announced the release of Fusion 3.1.
Fusion 3.1 expands self-serve OT data exploration in a cyber-secure, single-tenant ADX cloud expanding its use for everyday decision making, and growing ease of ingestion for data science driven applications.
Operational technology data can offer incredible insights, but far too often its use is restricted by missing context and data access bottlenecks. Fusion 3.1 removes a critical barrier making basic OT data exploration accessible to everyone.
— Dave Shook, Chief Data Officer and Microsoft MVP.
In addition to performance enhancements, Fusion 3.1 introduces the following new capabilities:
The brand new Fusion UI now features a Trender. In the past, Fusion users had to use an external product for trending – Time Series Insights Explorer. Now one of the most needed features for a citizen data scientist, trending functionality for the analysis of Fusion data, has been incorporated into the base product. This will both remove complexity, and increase a user’s power to analyze and understand their data. Fusion users can now select tags from the Fusion data model to trend the values and see their data directly inside Fusion.
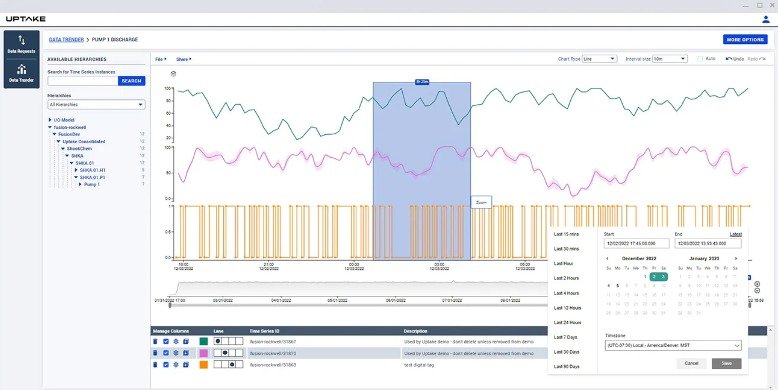
Fusion 3.1 introduces self-serve OT data exploration
We have revamped Fusion Data Requests. Data model and data requests are now part of a single UI – simplifying access. This allows end users to request their own data history to be uploaded into Fusion, removing IT roadblocks that hinder data exploration and data science.
In our efforts to harden cybersecurity, we have moved the configuration of our connectors into the Azure cloud. Configuration is now done through the Azure portal, and changes are pushed automatically to the connectors eliminating the need to log-in separately, thus reducing a potential area of risk.
Schedule a demo to see Fusion Data Hub in action.
Uptake provides industrial intelligence software-as-a-service (SaaS), translating data into smarter operations. Driven by unified data management and industrial data science, Uptake enable and delivers actionable insights that predict asset failure, advance ESG initiatives, mitigate catastrophic risk, optimize maintenance strategy, and protect operator safety, with 48 patents and recognition by Gartner, Verdantix, the World Economic Forum, CNBC, and Forbes. Uptake is based in Chicago, with an office in Mississauga, Ontario, and has a presence around the world.
One of the world’s leading integrated energy companies is engaged in The energy market is at a critical tipping point as the push for clean energy and economic instability wreak havoc on the old ways of operating. Those who hope to thrive in the new environment must accelerate their digital strategies. This Fortune 500 midstream energy company (whose core business is natural gas processing and transportation, with petroleum and electricity generation assets) was committed to doing just that, but their operational technology (OT) data infrastructure stood in the way.
This energy company’s historian administrator and IT support staff were being inundated with requests and the ever-growing need for data. Their custom script exporting data via CSV files wasn’t designed for the scale of data requested or the increasing number of requests they were receiving. For every request they fulfilled, another would follow asking for different context, more history or new tags. The list continued to grow as did the frustration.
Within a couple of days, Fusion was installed by the internal customer team. The Proof of Value (POV) deployment focused on OSI PI data, but would serve as a test for a broader data strategy they would
implement in the future. The immediate use case focused on automating delivery of data to Azure Data Explorer (ADX) for use in publishing Environmental, Sustainability & Governance (ESG) reports that were critical to their business strategy. Once the data was available in the cloud, Power BI was used to publish reports and enable delivery of data to 3rd party data consumers.
No matter what requests surfaced, the POV deployment proved the necessary data including years of historical data and all its relevant context was ready and waiting conveniently. It was now possible to easily map data coming from OSI PI model to the enterprise hierarchy, joining information from time series data to batch historical information. With this new data fabric they were able to fully encapsulate everything related to a particular asset – SAP work orders, safety reports, real-time sensor feed and other related documents.
While it was impossible to predict all future analytic needs, Fusion fed a flexible architecture that stood ready for new requirements. The entire customer team had growing confidence in the quality insights they were generating with the new ADX data store.
Their POV deployment proved that Fusion could be the flexible and adaptive backbone of their digital strategies. In less than one week, Fusion was installed and ready to evolve with their data architecture. It provided a sustainable capability to move, store, and access operational technology (OT) data in an ADX cloud environment rapidly, cost-effectively, and securely.
Complete, secure and timely movement of OSI PI data to Azure with OSI PI-AF (Asset Framework) model for context:
Fusion Data Hub
7405 Rte Transcanadienne
Suite 100
Montreal, QC H4T 1Z2
Canada
Email: [email protected]
© Fusion Data Hub 2025. All rights reserved. Fusion Data Hub is part of Aspire Software, a division of Valsoft Corporation.