
Not all oil and gas companies have borne the costs of unplanned downtime equally, and not all asset types warrant the same treatment.
Here are the six general approaches to maintenance in oil and gas, and their degree of impact on business outcomes.
With reactive maintenance, the equipment is allowed to run to failure. This may make sense for non-critical assets that have a limited impact on worker safety, enterprise risk, and bear marginal repair and replacement costs.
For critical assets that have a significant impact on process productivity and sustainability, running to failure is scarcely an option for safety, risk, and business continuity.
Service determined by preventative maintenance strategies primarily happens on a time- or usage-based interval. This often means that maintenance is scheduled while machines are still working in order to prevent unplanned downtime and maximize the lifespan and productivity of the equipment.
While effective in some instances for certain assets and for organizations whose industrial data may be hard to extract and move to the cloud, there are certain drawbacks to using this approach. It’s not an exact science, you run the risk of over-maintaining or under-maintaining your assets, and it relies on manufacturer guidelines for routine checkups but doesn’t take into account contextual information like weather or market prices.
Many machines fail because of multiple variables at play — design, maintenance history, duty cycles, and age, among other contextual factors. These failure patterns may not be apparent to the most seasoned maintenance and reliability practitioners, or even in an organization with diligent, digital record-keeping in enterprise asset management (EAM) software or a computerized maintenance management system (CMMS).
That challenge with figuring out where to focus your attention, amid all the data the possible decisions that could be made — based on asset risk, value, and criticality, in view of the overall fleet — is one of the reasons why unplanned downtime occurs. Maintenance and reliability teams are being pulled in so many competing directions, When downtime occurs, they can expect to face its many consequences, including:
Lost revenue because of offline equipment
Inefficiency with scrap materials, quality issues, and rework, increasing material and labor costs and resulting in delays in production
Lost hours for non-maintenance
Missed product shipments or service failures, resulting in lower customer satisfaction and danger to brand reputation
Worker safety and environmental incidents
In the 1960s, the Federal Aviation Administration conducted a series of investigations into aircraft reliability and found that, contrary to conventional engineering practices at the time, that time of usage was not an accurate measure of asset viability.
Follow-up research determined the importance of equipment inspections and repairs focused on asset reliability, or reliability-centered maintenance (RCM). With safety at risk on planes due to maintenance, the FAA findings set off a re-evaluation of practices in the profession. RCM questioned traditional engineering wisdom and looked to enhance equipment and component productivity (rather than asset life) based on design expectations of performance.
Where reliability-centered maintenance outlines expectations and priorities for maintenance, condition-based maintenance (CBM) is often the shape it takes in practice. CbM monitors equipment and component behavior, providing an opportunity for maintenance and reliability teams to manage the risk of their equipment and systems.
To this end, many maintenance teams have some degree of rule- or condition-based monitoring analytics. These analytics may also incorporate transactional, sensor, and design data to more accurately capture equipment and component functionality.
This group includes a range of technologies, from simple signal thresholds set by subject matter experts (SMEs) to advanced diagnostic tools that detect and identify abnormal activity across several inputs like temperature, pressure, and vibration.
Despite their differences, these analytics share the same goal. Condition-based analytics focus reliability engineering and operations activity toward heavy machinery with issues. When aggregated at the facility, regional, or company levels, they give the enterprise a way to more effectively manage its risk, productivity, asset procurement, and capital versus operational expenses.
Predictive maintenance improves upon these existing maintenance approaches, allowing maintenance and reliability teams to proactively manage their risk. It takes many industrial businesses incremental steps to reach a place where their people and processes are not yet in a position to do so. Planned preventative and condition-based maintenance programs are often a good place to start.
Predictive maintenance ensures that asset managers have the right knowledge and tools to keep critical assets running at peak performance, in accordance with operational priorities and market goals. Rather than an intensive change in maintenance, predictive maintenance is a guided approach towards cost-saving enhancement of planned PM activity already in place.
Using data from various sources like historical maintenance records, sensor data from machines, and weather data to determine when a machine will need to be serviced, operators can make more informed decisions about when a machine will need a repair. Predictive maintenance takes massive amounts of data and through the use of software, translates that data into meaningful insights and data points — helping to avoid data overload and guide engineers toward best practices.
As digitization, IIoT connectivity, and Industrial AI have advanced, industrial analytics have enabled models of machine behavior (and therefore the ability to service those machines) that:
filter out a variety of cases for asset conditions and their root causes, with prescribed steps to correct them and the market value of doing so
control for confounding variables that may contribute to an asset condition
incorporate additional benchmarks like historical performance and data from surrounding assets
Predictive maintenance detects potential failures and converts what could have been unplanned downtime into high-value planned PMs. This advanced visibility enables better production and operational planning. For this reason, predictive maintenance and predictive maintenance analytics are often also referred to as prescriptive — they enable operations to plan operations.
Today, predictive analytics and maintenance form the outermost boundary of augmented decision-making happening at scale.
In the future, asset management and operations teams should be able to combine all of the above maintenance analytics and their corresponding strategies — planned preventative, condition-based, descriptive, predictive, and dynamic — to optimize operational and maintenance costs, current productivity, asset lifecycle management, and market demand.
This alignment will be used to plan incremental improvements in operating plans and, in turn, the design of plants and equipment. Some have termed this the autonomous or self-optimizing plant.
This is where heavy industries are headed, but we’re not there yet. And for the majority of oil and gas companies, they’re just getting started on their journey from planned preventive maintenance to condition-based and predictive maintenance. Realistic evaluations of capabilities, and the range of data available for such initiatives, are important steps to begin.
The good news is that oil and gas companies can set up a framework to improve their maintenance and reliability — incorporating insights from their industrial intelligence to make decisions at the asset, process, site, and enterprise levels.
We recently announced that Fusion is supporting Microsoft Azure Data Explorer. What does that change mean for Fusion users, data wrangling, feature engineering, and getting the most out of industrial data?
In this blog, we explain some of the updates to Uptake Fusion, how it lends visibility into operational risk and productivity, and what users can expect.Azure Data Explorer was first announced in 2018 as part of the Microsoft Azure platform. It’s a Big Data analytics cloud and data exploration tool that ingests structured (like geolocation), semi-structured (like events), and unstructured (like notes from a work order) data. The goal: to do real-time analysis on large volumes of data.
Fusion now supports Azure Data Explorer. What that means for the data of asset-intensive companies is that their time series (instantaneous, historical, metadata), events, alarms, asset management, and work order data can be made available in a single place that is ideal for industrial intelligence.That’s where the visualization, query, and retrieval capabilities of Azure Data Explorer enrich the target use cases for industrial intelligence. Broadly speaking, Azure Data Explorer enhances data’s range, scale, access, and speed to readiness for industrial data analytics.
1. Range: Fusion supports the movement, storage, and curation of industrial data: now including events, alarms, asset management, and work order data in addition to time-series.
2. Scale: Uptake Fusion already ingests high volumes of data. Industrial businesses can support both the scale and scope of their data in the cloud with which to support valuable use cases in advanced industrial analytics and asset performance management.
3. Access: Rather than sitting in on-premise systems with limited access for select users, data in Uptake Fusion is available to approved first- and third-party users in Microsoft Azure.
4. Speed to Value: With industrial data organized and curated in one place with Uptake Fusion, industrial companies can quickly develop and apply industrial analytics. That translates in faster time from data acquisition to business value.
Azure Data Explorer has feature engineering built-in, meaning that data scientists and engineers can focus their time on the development of impactful analytics from more available data.
With Fusion supporting Azure Data Explorer, asset-intensive companies unlock dynamic visibility into operations.

Fusion extends object models to the cloud for specific use cases like AI/ML, enterprise reporting and auditing, asset monitoring, and digital twins. Integrating events and alarms data through Azure Data Explorer – like unplanned downtime and operational shifts – enable the creation of analytics for enterprise benchmarks and opportunities for operational improvement.
At the same time, Fusion maintains the integrity of data sources across business units and individual teams with metadata. The movement of metadata to the cloud allows enterprise datasets to reflect the complex organization of assets at an individual facility. Input from engineers and data scientists store critical asset and plant-level expertise in the cloud.
These flexible asset hierarchies in Uptake Fusion allow industrial data to be used, and then consumed again for analytics that meet the needs of individual data consumers.
Engineers and data scientists have typically gained visibility into risk through a manual process of collecting and then organizing industrial data.
In the instance of a bearing failure, engineers and data scientists look to quickly collaborate on understanding the downstream effects on the production process. These information systems can also be time intensive.
Fusion ensures that industrial data analytics reflect the operational risk as the dynamic system that it is: between component health and asset and process failures. When the causality of risk is known and can be stored, teams or the enterprise don’t have to recreate the wheel.
Use cases in industrial intelligence can be created with data in the cloud, with less development time and money. For industrial data scientists and reliability engineers, the data integration readies enterprise-scale data for analysis. It limits data wrangling and feature engineering, and moves beyond the siloed, on-premise order of old.
Data scientists and engineers can focus on value-add data analysis: action-oriented insights that uncover improved decisions to be made across the enterprise. And for sustainability initiatives, businesses can maintain the audit trail for compliance and shareholder reporting.
For decision-makers, enterprise-scale data prepared for industrial analytics directs attention toward valuable opportunities for improvement – rather than on the tools to uncover those opportunities. As asset-intensive companies undertake initiatives across their business, the availability of enterprise-scale data for industrial analytics can be adapted to their needs.
Having timely, relevant data empowers business decision-making. The dilemma comes from challenges with data access, which is especially true with ESG (environmental, social, governance) programs. Without robust ESG reporting based on data collected, companies struggle to meet compliance requirements, follow ESG frameworks and ratings, or address investor expectations around sustainability.
A global study on corporate adoption of ESG by Capital Group highlights the need for data alignment and preference for active management. Forty-nine percent of the 1,000 institutional and wholesale investors surveyed said a lack of robust data is holding back their organization’s further adoption of ESG goals like net-zero and lower carbon.
For companies with asset-intensive operations, wrangling operational technology (OT) data for ESG reporting is even more challenging. Manufacturers employ third parties worldwide. Oil and gas companies are involved in joint ventures in far-flung places. Data lives in disparate places too.
A recent webinar presented by Microsoft and Uptake offered guidance on solving the OT data dilemma. Several key points made in the webinar are helpful in thinking through how a technology solution can solve the data dilemma and help your company meet ESG reporting requirements.
Sensors on industrial machines alert the performance of those machines. In many industries, however, machines lack sensors and so data is difficult to capture on equipment performance.
The OT data reflects the health of the machines. Naturally, that data is of great interest to reliability engineers. It’s also a key indicator for business health and to board members, who are not only considering the bottom line of assets in operation but also their environmental impact.
Machine data stored in a central repository in the cloud makes the data accessible for advanced analytics that are essential for ESG reporting. The roadblock is getting the data out of the asset or out of the historian or system where the data is stored.
ESG reporting requirements call for data that can be guaranteed and is verifiable as fact. With data from sensors to the boardroom transferred to the cloud, it’s much easier to guarantee the accuracy of the numbers cited in reports and make them easily verifiable. Given the concern of greenwashing, having data you can attest to makes all the difference.
For data reporting, every business prefers using spreadsheets. The challenge occurs when data needs to be shared across sites, business units, and regions. Companies need technology that goes beyond the spreadsheet and solidifies your audit trail.
Your company has sustainability goals, and they’re shared across the enterprise. That’s why you need decision-making that happens enterprise-wide, so ESG reports reflect your company’s sustainability commitments and market variability.
Whether data is transferred to or stored in the cloud, it’s a cyber security risk. Look for technology that can protect your data on its journey to the cloud and can leverage the privacy of your own cloud environment. With Uptake Fusion, for example, Microsoft Azure protects all your cloud-based data and eliminates third-party exposure – all while the data serves as the single source of truth.
ESG reporting may be a requirement, but earning a profit and pleasing shareholders are also essential to the business. And so with reporting. That means your company doesn’t want a rip-and-replace solution that comes with months of integration and training. You need a solution offering the lowest cost of ownership, with flexibility in industrial intelligence use cases and data integration.
Chances are, your company is facing a data dilemma. The lack of data access is not only interfering with ESG reporting requirements; it’s also holding your digital transformation hostage.
But companies can liberate their OT data. Solve and centralize data, and you’ll discover the impact of having timely, relevant data on decision-making in all areas of operations.
How can engineers and data scientists get ROI from their predictive maintenance program? In this blog, we’ll run through some of the potential uses of industrial data, and how the resulting industrial analytics form part of a cohesive maintenance strategy.
If you missed the first part, where we covered the types of data that are useful in a predictive maintenance program, you can check it out here.
Now that pain points are known and outlined, valuable or bad actor assets identified, and the state of data has been captured, industrial businesses have the context to understand — and realize — the impact of predictive maintenance and reliability strategies.
First, industrial businesses need to understand the potential uses of their data. Questions might come up like:
What do you expect to achieve from a targeted transition to predictive reliability?
Do you have relevant root causes for equipment failures?
What failures would be most beneficial to predict, and at what lead times?
There are four major benefits from a transition to predictive maintenance. The first two benefits are not truly predictive in nature, but they are required for predictive analytics.
In turn, they are often bundled into a software solution but are broken out here.
This is sometimes called an equipment dashboard or KPI dashboard and is simply a way of providing the user with an intuitive way of visualizing the equipment data. This can take a format that drives problem recognition and programmatic efficiency.
It is not data analytics per se and does not run the data through any sort of AI or analytics algorithms. The data ingestion pipelines required to perform data modeling are often first surfaced onto a dashboard as a way to verify, validate, and adjust the data connectors that will be used later.
For example, a data surfacing dashboard could provide a screen that shows all trucks in a given fleet that will require preventive maintenance in the next week, like the below.
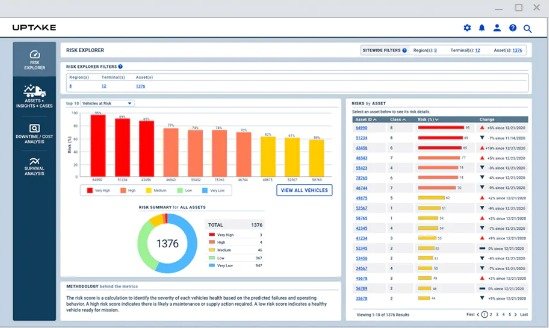
The preventive maintenance schedules would be ingested from existing Work Management System (WMS) software in a read-only type schema. This information would be available to dispatchers during route assignment activities without having to open the WMS preventive maintenance screen for each truck.
It’s one of the reasons why shared data access is a core part of the team-first approach to Industry 4.0 advances like predictive analytics.
Free-Text and label correction engines are a solution to clean up missing or inconsistent work order and parts order data. Pattern recognition algorithms can replace missing items such as funding center codes. They also fix work order (WO) descriptions to match the work actually performed. This can often yield a 15% shift in root cause binning over non-corrected WO and parts data.
An example would be a WO that was originally written to repair a pump, but upon closer investigation and troubleshooting, the maintenance crew determined that the problem was caused by a faulty motor starter that required replacement.
By training the “cleanup engine” to look at the resources actually used for the repairs (electricians instead of mechanics) as well as the parts used (a motor starter and not mechanical pieces or parts), the WO description can be changed to reflect the true issue being addressed. This data correction improves future trend reporting.
With programmable logic controller-generated threshold alarms (like an alarm that is generated when a single sensor exceeds a static value), “nuisance” alarms are often generated and then ignored.
These false alarms quickly degrade the culture of an operating staff as their focus is shifted away from finding the underlying problem that is causing the alarm. In time, these distractions threaten the health of the equipment, as teams focus on making the alarm stop rather than addressing the issue.
A multivariant approach “cuts through the noise” by finding the trends and patterns behind the seemingly random alarm chatter.
This approach should allow operators to focus on what is truly important. By running AI algorithms on these single-point alarms, patterns emerge that improve both the lead-time of true positives as well as by greatly reducing the number of false positives.
Operators are provided insights that are:
in advance of the problem,
can be trusted to be real, and
are specific enough to allow the alert to be isolated to one machine or subsystem and to a small group of related failure modes.
This is the bread and butter of data analytics software — the area of cool AI that uses multiple variables related to a machine to statistically predict a given failure mode.
Implemented correctly, these models are truly amazing in that they can often predict an imminent failure sometimes days in advance, and from seemingly unrelated data sources. Predictive insights allow time for an organization to prepare for an equipment downtime as opposed to reacting to an emergent failure.
It is unrealistic, however, that there will be an analytics model for every potential failure mode for a given piece of equipment. It then makes sense that any remaining failure modes (those not being detected by the analytics model) would be continued to be addressed by more conventional methods (performance of a time-based or condition-based maintenance task).
With the fraction of industrial assets that wear out in predictable ways by time and usage alone, it still makes sense to stick to preventative maintenance in some instances.
Any comprehensive maintenance strategy or long-term asset management plan must start with a thorough understanding of the failure and degradation modes, locations, applicable stressors, and elapsed time for the first detection of that failure or degradation.
An understanding of the impact of maintenance being performed on short and long-term reliability is required to properly understand the health of equipment. Each cause and location of equipment failure should be understood in relation to the amount of time before that cause is detectable for that location, and any maintenance tasks being performed should be mapped to the degradation modes that it mitigates.
As a result, the maintenance task being performed is the mitigation strategy for this degradation. This is equally true when the mitigation strategy for a given failure mode is the implementation of a predictive analytics model. The output of each predictive analytics model should be mapped to the failure modes or locations that it mitigates. This failure mapping allows for a comprehensive understanding of the total maintenance strategy as it relates to the mitigation of applicable failure modes.
For any degradation that is completely mitigated by a predictive analytics model, conventional maintenance tasks for the same degradation can then be eliminated. If the task also mitigates degradation modes outside of those bounded by the predictive analytics model, it may be appropriate to adjust its scope and to also adjust the performance frequency.
Predictive analytics is an exciting and promising way to improve the reliability of key assets and components. Moving to a predictive maintenance program doesn’t happen overnight, and even once in place, preventive maintenance tasks may still be appropriate for some types of industrial equipment. Predictive maintenance cannot be done in a vacuum.
Engineers and industrial data scientists need a thorough understanding of the failure modes and locations being detected by the predictive analytics model as well as by the “legacy” PM tasks. Once they do, they’ll be able to tap into the great value of advanced warning on their assets.
The areas of Artificial Intelligence (AI), Machine Learning (ML), Industrial Data Analytics, and Industrial Internet of Things (IIoT) seem to be the latest ‘Last Frontier’ of equipment reliability. There is an attitude out there that contends that the adding of sensors will automatically result in an improvement in reliability.
I hate to be the bearer of bad news, but hooking sensor wires up to a piece of machinery will not automatically give it increased reliability, better breath, or any other often-advertised superpowers. That being said, there are some very real benefits (and yes, cost savings) that can be realized by a disciplined implementation of advanced industrial analytics into an existing reliability program.
The usefulness of AI/ML (as well as predictive maintenance (PdM) and preventive maintenance (PM)) is not just to prevent failures, but to give you an accurate assessment of the measured (or inspected) parameters.
In other words, the AI piece of the puzzle is drawing data from sensors and other data sources and distilling this information into something that you, as a human, can understand and act upon. The resultant decisions and actions are what prevents failures.
The average oil & gas facility loses 32 hours of productivity each month to unplanned downtime. (Source: Automation.com)So, when you think about it, the goal of all of these acronyms is to provide accurate, understandable information available in a timely manner so that you can make those decisions as quickly and accurately as possible. Due to the lack of maturity in the marketplace (both on the vendor-side as well as on the consumer-side), most organizations don’t know how to distinguish the several offerings that are out there.
As a result, millions could be spent based on the charisma of the salesperson and nothing else. Creating a smarter consumer that understands where their organization is currently, where they want to go and the various options available on that journey is the goal of this blog post.
Below is a list of some things to consider and questions to ask when considering or establishing a predictive maintenance project plan.
This should include an unflinching assessment of which machines are bad actors. These are critical assets that are responsible for lost revenue and higher than necessary overall costs. This evaluation includes:
Preventive Maintenance expenditures
Corrective Maintenance expenditures
Capital (Modification) expenditures
Costs of lost production
Costs of scrapped product
Safety, Environmental and Regulatory cost impacts
Any project plan should rank components by the above criteria and prioritize steps and components according to these criteria. The transition to predictive maintenance should be performed on the most impactful component type first, and then, when the process and pitfalls are well understood, rolled over to other components in order of importance and return on investment.
Nobody’s data is perfect, but here are some things to consider before you start out. There are generally three different classes of data.
Time-Series Data (or data that indicates the current state of an asset over time)
Live Sensor Data
Are the most important components sensored?
Are those sensors, alone or in combination, able to detect degradation for your most troublesome failure modes? Again, just sensoring components does not inherently improve performance.
How exportable or accessible are these sensor readings (do they stay in the programmable logic controller (PLC), are they already being sent to a data lake or estate, etc.)?
What is the cadence or sampling rate of the sensor readings?
Sampling rates may have to be adjusted based on specific failure modes being detected and on the desired lead-time for these failure modes. You are not going to get a half-hour lead-time on a prediction when your sampling rate is at once per hour.
Are there currently PLC or controller logic threshold alarms for the equipment?
Are these alarms retrievable either in live-time or near live-time?
These are not predictive in nature but can be used to establish predictive data models.
Inspection Reports (alarm response inspections, RCI follow-up inspections, post-maintenance testing)
Are these records digitized?
Are these records indexed in a way that provides for easy retrieval (by date, by equipment ID number, etc.)
Indexing an inspection to an RCI document number may make sense at the time, but ultimately, it needs to be retrievable as part of the equipment or history record of each applicable component.
Rounds sheets (thermography, vibration, etc)
Are these records digitized?
Are these records indexed in a way that provides for easy retrieval (by date, by equipment ID number, etc.)?
Indexing an inspection to a periodic inspection activity may make sense at the time, an index to the equipment is still required for proper assessment of each component’s individual health.
Historical Work Order and Parts Data
Is there Work Order history data that is consistent and accessible? Where possible, greater than 5 years of historical data is valuable.
Work order history should include:
As-found condition (either codes or text)
A description of work performed
Resource hours expended
Parts replaced (noun name, quantity, and price)
Free-text and cost center information should be ‘cleaned’ by a supervised learning free-text cleaning program to ensure that any trends being shown by the data are accurate.
Operator Logs and Shift Notes
Are these records digitized?
Are these records indexed in a way that provides for easy retrieval? Indexing by date will usually be the only option here, but cross-indexing should be performed as well.
Consideration should be given to ‘cleaning’ free-text formation to allow for correlation (indexing) and subsequent trending of data at the individual component level.
Lubrication Records
Are these records digitized?
Are these records indexed in a way that provides for easy retrieval (by date, by equipment ID number, etc.)?
Indexing lubrication to a periodic activity may make sense, but a cross-reference to the equipment is still required for proper assessment of each component’s individual health.
Consideration should be given to cleaning free-text information to allow for correlation (indexing) and subsequent trending of lubrication history at the individual component level.
This can be data like asset failures, RCIs, modifications, external industry notices.
Design Changes (Modifications)
Are these records digitized?
Are these records indexed in a way that provides for easy retrieval (by equipment ID number, etc.)?
Are these records also cross-referenced to any ‘driving’ documents (RCI, corrective work orders, external notice, etc.)?
RCI Determinations
Are these records digitized?
Are these records indexed in a way that provides for easy retrieval (by date, by equipment ID number, etc.)?
Are these records also cross-referenced to any ‘driving’ or corrective actions documents (corrective work orders, external notice, design changes, etc.)?
Getting Started on the Project Plan
Don’t worry if your organization doesn’t know the answers to each of the above questions — and don’t worry if you do know the answers but don’t like them.
Industrial intelligence should start with where you are today and should be able to establish a clear roadmap to where you want to end up. Those questions above are intended to prompt questions like:
Is my process data sufficient to know the current state of my pumps?
Do I have any records of what actually caused my past turbine failures?
Once you have run down this list of questions, you should have a good idea of where to start with your data for it to be ready for analytics and predictive maintenance.
It may take time to scope out the potential uses of industrial data, and how to create a strategy for unified data management to make these use cases possible. In part II of this blog, we’ll cover how industrial businesses can begin to realize the value of their data.
As manufacturers look to meet the competitive mandate to digitally transform their operations, the digital skillset of their team will be critical to their future success and resilience. For many manufacturers, finding skilled talent can be a challenge. In a recent survey from Deloitte and the Manufacturing Institute, manufacturing executives reported that recruitment is more challenging today than before the pandemic.
The study also found that the lack of available skills in today’s workforce could leave 2.1 million U.S. manufacturing jobs unfilled by 2030, costing manufacturers $1 trillion in lost productivity. For their part, 77% of manufacturing workers reported a willingness to retrain to improve their future employability according to a 2020 PwC survey.
Though industrial businesses and workers agree that training on digital skills is instrumental in building out future productivity, many manufacturers have simply not tied work performance to learning and development. A 2019 Tooling U-SME survey of manufacturers found that industrial businesses were not bridging the skills gap, contributing to a high cost of turnover rate and lost productivity. Just 12% had training and development programs in place, with one-third budgeting for external or on-the-job employee development.
To build out attractive recruitment and retention programs, manufacturers need to develop scalable digital training. Here are 7 ways that manufacturers can engage and guide their workforces as they build out their digitally transformed operations.
1. Executive Ownership of Building a Smarter Manufacturing Team
Direction from manufacturing executives can ensure their company pairs its training programs to tangible business objectives and strategic goals, holding leaders accountable for making decisions that also promote digital transformation, employee retention, and productivity. It requires leadership to be literate in digitally enabled opportunities and communicate associated goals clearly to employees to earn their buy-in. A data integrity committee, for example, can accomplish this board-level oversight of workforce initiatives while advancing strategic data-driven business goals at the frontlines.
2. Providing access to online tech courses and nanodegree programs
Learning platforms like Udacity and Coursera offer courses in anything from Six Sigma proficiency to Robotics for Advanced Manufacturing. Training initiatives do not need to happen on the job, but creating opportunities for learning by providing access to these platforms will attract new hires and build a culture that emphasizes the importance of continual digital learning.
3. Partnering with local schools to create a talent pipeline
Take Harper College in Illinois, for example, which previously had dismantled its manufacturing curriculum. With the support of the Illinois Network for Advanced Manufacturing (INAM), local high schools, and federal grants, Harper College revamped its manufacturing curriculum, filling 30,000 open jobs paying on average $29 per hour. With input from INAM, the redesigned and manufacturer-influenced curriculum enables students to earn an associate degree debt-free with guaranteed employment upon graduation by pairing specializations in Automation, Metal Fabrication, Precision Machining, or Supply Chain and Logistics Management and apprenticeships.
4. Tapping into networks of right-skilled workers
For smaller manufacturing firms who struggle to recruit a workforce floor-ready for advanced manufacturing, contractors represent an opportunity to take advantage of the technical skills required. A manufacturing-focused talent marketplace like Veryable is key to connecting flexible and skilled workforces to manufacturing firms in need of flexible labor.
5. Using simple out-of-the-box software
A digital solution that suits Industry 4.0 is one that simply works — manufacturing firms can no longer afford to leave technology users to weave, bundle, bridge, abstract, translate, connect, develop, and outsource disparate and disjointed pieces of software.
Uptake Asset Strategy Library® Explorer was created with this need in mind, providing industry-proven preventative maintenance strategies on-demand. As asset-heavy industries struggle with knowledge transfer as many longtime maintenance and reliability professionals look to retire, PM Strategy Explorer digitizes domain expertise and provides step-by-step maintenance tasks based on specific failure modes for critical assets.
6. Software demos for employees by power users
Offering ample time and opportunity for manufacturing workers to share knowledge can help reskill and upskill employees across an enterprise. Asynchronous access to demos through video recordings and instructional guides prepared by team members can help new personnel get up to speed quicker. Think of it as your very own Coursera or Udacity, an internal one-stop-shop for learning and development.
7. Making OT data available to the enterprise
Operational technology (OT) data has long held back asset-intensive operations like manufacturing from cost-effectively taking advantage of applications like AI/ML, digital twins, and operational orchestration. In particular, the compression of OT data and its restriction to proprietary formats often keeps data locked in unusable formats for preferred methods of consumption.
Fusion, for example, makes business and maintenance users both power users of OT data, allowing them to cost-effectively develop high-value, multi-purpose industrial applications as they wish. It presents the critical context for various data consumers in the organization, retaining the same object model used to query OT data on-premise but in the cloud to scale decision-making.
Making Talent Development a Competitive Advantage
On-demand access to software, datasets, and learning are key as manufacturers look to earn buy-in from their teams. Those manufacturers that will be competitive are those that invest today in developing a culture of lifelong digital learning to guide their workforces through Industry 4.0.

Business demands have forced manufacturers to be more agile. Smart manufacturers are adopting technology, including digital twins, to move faster. Using a digital twin in a manufacturing environment can fast-track the discovery of production bottlenecks, drive efficiencies, lower costs, reduce environmental footprint, and help manage risk.
However, mystery still surrounds the concept and use of digital twins, from defining what they are and their strengths. In this blog post, we define what a digital twin is, how manufacturers are using it, and share some keys for success.
This definition of a digital twin comes from the Digital Twin Consortium:
“A digital twin is a virtual representation of real-world entities and processes, synchronized at a specific frequency and fidelity.”
In short, what exists in the real world like an assembly line is represented in a digital world. Both worlds are tethered so that data can flow, and the worlds mirror each other. Digital twins use real-time and historical data to represent past and present, as well as simulate probable futures.
Data drives the makeup of the digital twin. Many organizations use 3D models, but it’s not for everyone. A manager may require a digital twin expressed as a dashboard, while an operator will need an interface fit for a factory floor.
According to the Digital Twin Consortium, “digital twins can be tailored to use cases; they’re powered by integration, built on data, guided by domain knowledge, and implemented in IT/OTsystems.”
Digital twins can transform operations, accelerate a holistic understanding of an entire entity or process, drive optimal decision-making due to test-run scenarios, and result in proactive action. Once it works digitally, the decision will more likely generate the same result in reality.
Manufacturers typically have multiple use cases with complex tasks. As if the challenge wasn’t hard enough, it’s compounded by feeding the many use cases into one canonical data model.
Fusion addresses this challenge by thin slicing the use cases, allowing the canonical data model to fit specific uses and/ or required industry standards such as ISO 22400, which defines key performance indicators (KPIs) used in manufacturing operations management. Or ISO 50000, a standard for establishing, implementing, maintaining, and improving an energy management system.
As a virtual representation of the physical world, digital twins must respond to real-life challenges of the physical assets. Improvements in asset performance is a core use case.
Analyzing data (time-series, real-time, and transactional) unified in a data lake environment by Fusion can produce insights into shop floor operations. Technicians can put insights to work, improving product quality, addressing production processes, measuring environmental impact, understanding yield losses, identifying risks on asset reliability, or any number of other initiatives.
By leveraging data for insights, you can also infuse your manufacturing plant’s preventive maintenance program with predictive capabilities.
Only sharing the promises of digital twins would ignore the perils. There are also keys to success. Here, we’ll document both.
1. Beware of the “One Size Fits All” Digital Twin
No single platform can serve the digital twin needs of a manufacturer. The era we’re in now demands flexibility, which means assembling the best components per use case. The trick is to ensure that these components promote integration with Open APIs.
2. Cleanse and Catalog Data
Digital twin data comes in different types and from multiple sources. It’s time-series, transactional, structured, or unstructured data. It comes from a historian, a control system, smart sensors, enterprise systems, or external sources. All that disparate data needs to be cleaned and organized.
3. Unify Data in the Cloud for User Actions
Unifying data in the cloud provides scalability to support new user interactions from 3D engineering tools to geospatial environments that improve operations.
4. Pursue Business Goals
A digital twin excels when serving business needs. However, being viewed as a shiny object for a digital transformation program can result in wasted spending. Defined use cases and key performance can guide manufacturers to tangible value.
5. Keep Current with Aging Assets and Maintenance Records
Assets degrade over time and require ongoing maintenance. Whether a repair, revamp, or replacement, your digital twin must keep up with asset lifecycle changes.
For process manufacturers seeking agility, digital twins that apply the digital world to reality on the shop floor can help, all while solving business problems. Having asset data unified in a cloud environment also opens the door to analytics to help your facility.
When it comes to industrial machines, context looms large. Especially when the difference in data signatures between various operating contexts, original equipment manufacturers (OEMs), maintenance histories, and productivity thresholds reveals whether one asset needs inspection and another is performing optimally.
To borrow a pet analogy, it is the difference in knowing that a temperature of 102 degrees Fahrenheit is perfectly normal for a puppy and that a person has a fever.
Context matters, and it is the reason why process-intensive operations in industries like chemicals, oil and gas, mining and metals, manufacturing, and energy and utilities, are facing something like the puppy-or-person question at scale. Metadata is taking on an increasingly important role in industrial intelligence.
Issues with valuable industrial equipment factor into asset and personnel utilization decisions. Competitive pressures demand companies make smarter decisions in each function of their business. And it’s not just the balance sheet that shows the importance of data-backed decisions.
With environmental, social, and corporate governance (ESG) concerns top-of-mind, intelligence for decision-makers at each echelon of the organization begins with a precise understanding of the metadata — the context. For different stakeholders with various decisions to make, context is (excuse us) contextual.
Right now though, many companies have trouble seeing that context in existing datasets. Much of that difficulty owes to the original design of operational technology (OT) systems like supervisory control and acquisition (SCADA) systems or data historians.
These on-premise collection systems were made for plant staff with a deep familiarity in asset performance and maintenance. They did not place a premium on context for those who knew how equipment operated. But keeping context, especially for those without a working knowledge of industrial assets, can help teams uncover valuable use cases in asset planning, monitoring, and reporting. It also opens up the possibility of multi-purpose solutions from a single source of industrial data for decision-makers.
Industrial asset expertise is hard to come by and expensive to develop, but it is critical as organizations look to share and delegate decision-making responsibilities to a growing set of data consumers and stakeholders. With the equipment and site expertise necessary to put datasets and industrial assets in their proper context, process-intensive operations are counting on legacy OT systems to extract and make information useful for the rest of the organization.
As a large part of the industrial workforce prepares to retire within the next few years across heavy industries, that dependence will be unworkable. Industrial organizations need a better way.
But since on-premise collection systems require more hardware and licenses in order to process data for more users, many companies must make decisions about who has access to data. These licensing restrictions make it difficult for companies to train various departments in the management of data. It also limits organizations from taking advantage of the breadth of industrial applications available to them once their data is in the cloud. The payment model of traditional on-premise systems now jeopardizes that progress by favoring a narrow user base of OT data.
For business analysts, data analysts, and executives, if a business unit or organization clears those high-cost barriers to an enterprise data lake strategy, they face another, similarly costly challenge of metadata loss. And for engineering and operations leaders looking over the performance of individual sites or facilities, metadata and data quality are critical for building out best practices.
Shared access to datasets remains expensive, in spite of organizational ownership over data. A new form of metadata management is in order: one that scales and adapts to data consumption needs as the priorities of industrial intelligence change. OT systems must cater to the growing appetite for smarter business decisions from all corners of the modern industrial organization: management, engineer, technician, data scientist, IT, business analyst.
The modern database historian emerged in the 1980s as a response to higher data intake. Industrial equipment, outfitted with better instrumentation and streaming higher and higher volumes of data, outmatched existing record-keeping. Earlier archival systems in individual spreadsheets, including (and sometimes still) those recorded with paper and pen, could not keep up with the volume and velocity of the newly available data. OT engineers adopted the on-premise historian as an archive of single-site information.
The new systems were a gold mine of information. OT environments, in addition to collecting asset-produced information, stamped each data point with descriptive information that distinguishes that figure among other strands of data for each tagged asset. Metadata included attributes like pressure, volume, location, and temperature. Together, they placed industrial asset data into perspective. It was this data about data that enriched the value of a dataset with greater granularity, more accurately reflecting the entire operating context of an asset.
Today, the story around the collection of data in OT systems is much the same. Each of these descriptive points about the data could paint a more holistic view of asset performance.
Except: hardware limitations kept these systems primarily as onsite technologies, suited to the analysis of on-premise assets. The data historian was a feasible solution for plant staff to quickly collect, query, and analyze OT data.
Before the emergence of the cloud, metadata from industrial control systems took on the individual characteristics of data collection at a single site. Since then, varied metadata collection practices have created a patchwork of different standards. That variation has obscured the visibility of operations into asset performance.
Ideally, metadata management includes detailed and understandable definitions, code values, data quality metrics, and data profiles. For some departments and organizations, this proves to be the case.
As often happens, however, metadata standards are local — most understandable to power users and their on-premise control systems. Beyond the consistent users of these systems, there was no need for translation. Likewise with asset frameworks or taxonomies — individual facilities developed different norms for collection and aggregation.
While these data collection, tagging, and naming conventions are familiar and useful for the power users of on-premise historians, many interested data consumers themselves lack the onsite or engineering backgrounds to know what to make of the metadata. That specificity can render datasets meaningless for people outside the environment.
It would be difficult, for example, to associate one value or another with this or that pump. For others without asset expertise, the difference in temperature readings between a puppy, person, and pump is not that clear. Without a reference system for context, metadata can contribute to imprecision and confusion for the enterprise.
Hardware limitations and differences in metadata management between sites made data access difficult. The loss of context can be an even more fundamental challenge to power users of on-premise systems.
In many historians, preconfigured settings around time-series data compression save licensees from having to buy additional hardware required to handle more metadata. Instead, the historian reduces quality, storing metadata like temperature and pressure at lower granularity — often by reducing the frequency of collection or by having a predefined level of parameters for each of those data tags based on groupings of assets.
In other cases, the historian removes select metadata values entirely from storage. Compression leads to the loss of important variables in the entire operating context. It leaves the enterprise short of the full picture.
Real-time values are just a fraction of the data available to operators. Most organizations also have many years of historical data — and metadata — in their on-premise systems. With enterprise imperatives to migrate that data to the cloud, they face similar challenges to preserve high-resolution metadata and historical data.
Though cloud connectivity add-ons from on-premise collection systems providers have eased the migration of data beyond individual sites, operators have faced challenges with the depreciation of metadata through compression and lacking support for coexisting data models. Recurring payments for cloud migration and integration services contribute to higher data management costs. And those one-off fees fail to treat the basic issue of metadata loss – the sacrifice of quality for quantity of data.
Asset framework hierarchies are also regular casualties of OT data transfer to the cloud. Users of on-premise systems with cloud connections must consistently rebuild these hierarchies in the cloud. Even so, many data historians cannot support coexisting data models. In the cloud, multiple coexisting data models allow different consumers to see the same dataset within a context that makes sense for their decision-making responsibilities.
Metadata compression and single data models restrict visibility into operations. Integrations and plug-ins in the cloud from on-premise providers to promote data integrity are unable to treat the root issue of unscalable metadata management. And then with different metadata standards, companies lose the context critical for the development of industrial intelligence.
As many process businesses turn to a data lake strategy to leverage the value of their data, the preservation of metadata in the movement of OT data to their cloud environment represents a significant opportunity to optimize the maintenance, productivity, sustainability, and safety of critical assets.
The loss of metadata has been among the most severe limiting factors in the value of OT data. By one estimate, industrial businesses are losing out on 20-30 percent of the value of their data from regular compression of metadata or losses in their asset hierarchy models. With an expertise shortage sweeping across process-intensive operations, many companies will need to digitize and conserve institutional (puppy-or-person) knowledge, beginning with their own data.
They now can — cost-effectively and at scale.
As companies look to make Industry 4.0 applications like AI/ML, digital twins, and operational orchestration a central part of their operations, they are again confronting challenges with silos. Especially when different teams or departments have different degrees of data access and readiness, and sometimes just struggle to get user licenses to tap into their data, priorities around digital transformation can reflect the demands of individual business units.
Through cloud computing, teams across data science, maintenance, and business analytics can now drive enterprise improvement without the traditional misalignment.
The specific challenges and needs of individual teams have revealed the need for purpose-built digital solutions unlocking applications like AI, digital twins, and automated reporting in order to drive larger enterprise goals.
However, unclear or conflicting priorities in an organization can make the adoption of advanced analytics difficult. False starts with digital transformation are costly and difficult to rein in on the original budget and timetable, in addition to their impact on worker fatigue when it comes to pursuing new initiatives.As companies realized the need for solutions like remote monitoring and on-demand expertise during the pandemic, many also increased their spending on advanced analytics.
Research from Harvard Business Review shows that $1.3 trillion was spent on digital transformation initiatives in 2018 alone, with an estimated $900 billion in waste from companies reporting that they did not meet their goals. That spending is set to rise to $2 trillion annually by 2022.
When projects meet their mark, companies have sustained forward-thinking initiatives as a foundation for future excellence. In an analysis across asset-intensive industries, McKinsey found that industrial facilities and companies with low digital maturity improved their EBITDA by 3-5 percentage points on average through digital transformation initiatives.
Even organizations experienced with digitization initiatives stood to gain from adopting maintenance strategies that improved their preventative maintenance (PM) program — about 1-3 percent according to the same study.In these initiatives, a data management strategy like a data lake was key. In the case of operational technology (OT) data, secure storage and user-friendly retrieval are catching industrial control systems up with the maturity of IT infrastructure.
Fusion, for example, makes OT data legible throughout the organization to different stakeholders with the data models that matter to them. It has enabled teams to steer clear of data compression and limited user licenses, allowing internal and third-party data consumers to take advantage of data with high granularity and in an open format. In turn, companies have accelerated the deployment of operational applications from years and months to weeks.
As a result, teams of data consumers gain visibility into conditions at the level of the facility. A data lake strategy empowers teams to tackle their specific strategic initiatives that ladder up to enterprise business objectives, sustainability goals, and regulatory requirements — all from a single repository of contextualized data. Not just limited to the traditional power users of industrial control systems, the cloud enables teams throughout the organization to capitalize on the value of OT data.
For example:
Data science teams have cost-effectively integrated key data sources to develop digital twins and advanced analytics applications.
IT and operations teams have uncovered insights that improved asset performance by storing OT data in a cloud environment for further analysis.
Engineering, maintenance, and reliability teams have easily accessed cost avoidance insights from their OT data in the cloud to better oversee the lifecycle of asset utilization through data-backed planning, optimization, execution, and tracking of preventative maintenance activities.
Executives and finance, accounting, and business analytics teams have used Microsoft Power BI, Power Apps, and Azure Time Series to track, measure, and visualize KPIs, moving from pen and paper to automated reporting.
Through the power of data access backed by the cloud, teams enjoy a new agility to develop Industry 4.0 applications without diminishing the value of use cases to the rest of the enterprise. Business units can now cost-effectively unlock incremental and compounding improvements with a clear line of sight towards better productivity, maintenance, sustainability, and safety.
Increasingly, data usage is the differentiator — the factor critical to the productivity, reliability, and sustainability of heavy assets.
The series of challenges common to heavy industries, including aging infrastructure, market volatility, and the wave of retirements among experienced personnel, are compelling organizations to look for ways to more fully derive value from their data.
Many companies are having difficulty just leveraging their operational technology (OT) data. By some estimates, only 5% of OT data is used right now. Of that 5%, even less of it is useful after wrangling, cleansing, and organizing. Gartner estimates that poor data quality alone contributes to a 30% loss in revenue per business on average.
In a variety of process-intensive industries, from chemicals, oil and gas to renewables, manufacturing, and mining, the primary barrier to uncovering the value of data is the outdated design of the data historian. Intended as on-premise collection systems, they are now being stretched to enable enterprise use of OT data. Excessive fees by tag and the number of users must be paid in order to make data more accessible.
More hardware is needed to scale, and less of it when a site adjusts production. No matter the case, high latency because of enterprise data demand complicates data collection by plant staff.
Whether internal or third parties eventually consume that data, the initial movement of OT data to the enterprise for consumption is slow-going and expensive.
And because it is imperative to make data-backed decisions, power users of on-premise automation and data historian systems no longer have a monopoly on asset-produced information. Real-time and historical data streaming from smart sensors into collection systems are of greater importance to various business functions. They all need context-rich OT data to make quicker, smarter business decisions and the cloud to provide the scalability of a data lake to do so.
With company-wide use of on-premise collection systems, organizations have encountered challenges in high data demand and cyber-risk. Multi-vendor access to critical plant systems leaves SCADA and on-premise systems struggling to securely process and store data, keeping IT in security limbo. It is a leading reason why a majority of industrial control systems experience a breach annually.
With the rise of cloud computing and industrial connectivity, a new solution has emerged to operationalize real-time, historical, and metadata in the cloud. Fusion leverages the advances in cybersecurity, scale, and interoperability of IT infrastructure to distribute access to OT data and analytics for high-value industrial intelligence across the enterprise—no limits by tags or number of users.
Fusion Data Hub
7405 Rte Transcanadienne
Suite 100
Montreal, QC H4T 1Z2
Canada
Email: [email protected]
© Fusion Data Hub 2025. All rights reserved. Fusion Data Hub is part of Aspire Software, a division of Valsoft Corporation.